Reduced Energy and Utility Costs
Monitor electricity, water, and gas usage in real time to identify wastage, leakage, and inefficiency — helping industries cut unnecessary expenses and lower operating costs.
The Energy Monitoring and Reporting System (EMS) is an intelligent industrial solution designed to monitor, analyze, and optimize the consumption of electricity, water, and gas across your facility — all in real time.
By connecting with energy meters, flow meters, PLCs, and sensors, EMS captures live data from various utilities and converts it into interactive dashboards, automated reports, and actionable insights.
Monitor real-time energy, water, and gas usage across departments or equipment
Detect wastage, leakages, and inefficiencies instantly
Generate daily, weekly, and monthly reports for analysis and benchmarking
Support energy-saving, cost-reduction, and sustainability goals
EMS empowers industries to take data-driven decisions that improve operational efficiency and resource utilization. With automated reporting, predictive alerts, and trend analysis, users gain full visibility and control over their utility performance — anytime, anywhere.
In essence, EMS transforms raw utility data into valuable business intelligence, helping industries move toward a smarter, efficient, and sustainable future.
The Energy Monitoring and Reporting System (EMS) works by seamlessly connecting industrial equipment, meters, and sensors to a centralized software platform — enabling real-time tracking and intelligent analysis of energy, water, and gas consumption.
EMS integrates with energy meters, flow meters, PLCs, and sensors using industrial protocols like Modbus, MQTT, and OPC UA. This enables live data collection from multiple utilities and machines across the facility.
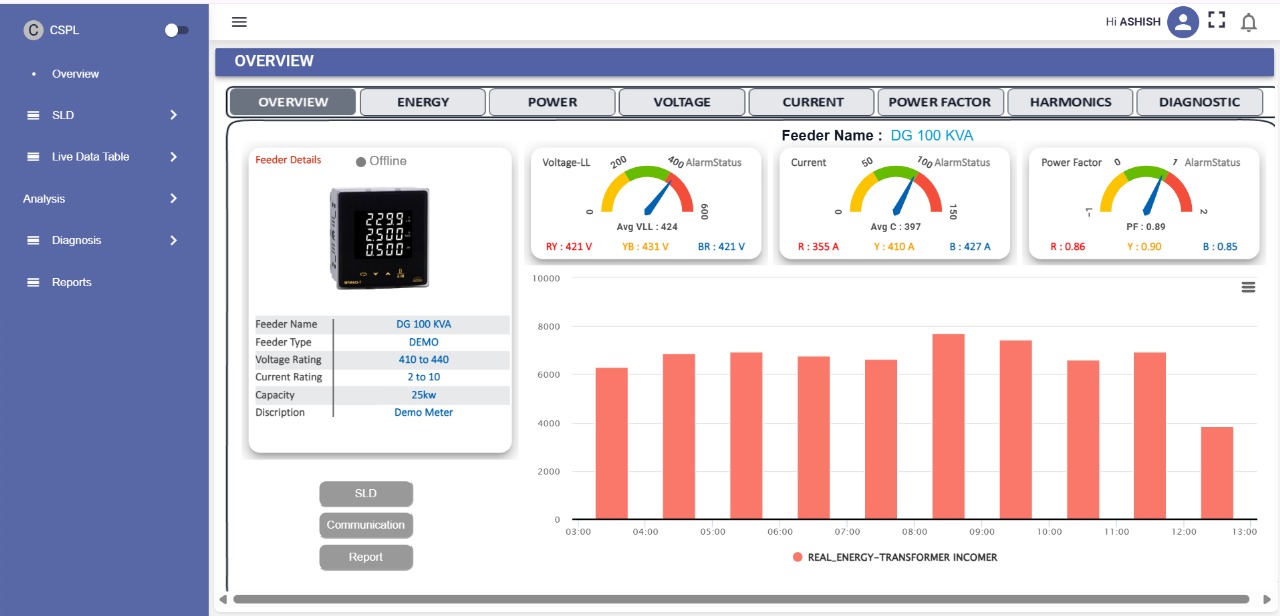
The connected devices continuously send real-time data — including parameters like voltage, current, kWh, flow rate, and pressure — to the Factory Data Manager (FDM) software platform.
FDM processes and visualizes the data through interactive dashboards, KPIs, and trend charts. Users can monitor performance, detect anomalies, and benchmark efficiency across departments or shifts.
Built-in automation rules trigger alarms, notifications, or emails when thresholds are breached or unusual patterns are detected — preventing losses and downtime.
EMS automatically generates daily, weekly, and monthly reports in Excel or PDF formats.These reports help management identify energy-saving opportunities, optimize consumption, and track performance improvement over time
In today’s industrial environment, energy, water, and gas are not just resources — they are major operational costs. Without proper monitoring, factories often face:
An Energy Monitoring and Reporting System (EMS) helps overcome these challenges by providing real-time visibility, intelligent alerts, and accurate reports, enabling industries to:
The EMS is designed for any organization that consumes significant electricity, water, or gas and aims to optimize its usage.It is ideal for:
Monitor electricity, water, and gas usage in real time to identify wastage, leakage, and inefficiency — helping industries cut unnecessary expenses and lower operating costs.
Get a complete view of your plant’s utility performance through live dashboards and KPIs, enabling quick decisions and immediate corrective actions.
Receive instant alarms and notifications for abnormal consumption or faults. Prevent breakdowns and downtime with data-driven predictive maintenance.
Generate daily, weekly, or monthly reports automatically in Excel or PDF. Simplify audits, benchmarking, and sustainability reporting with accurate, ready-to-use data.
Use insights from EMS to optimize equipment performance, improve production efficiency, and move toward a greener, more sustainable operation.