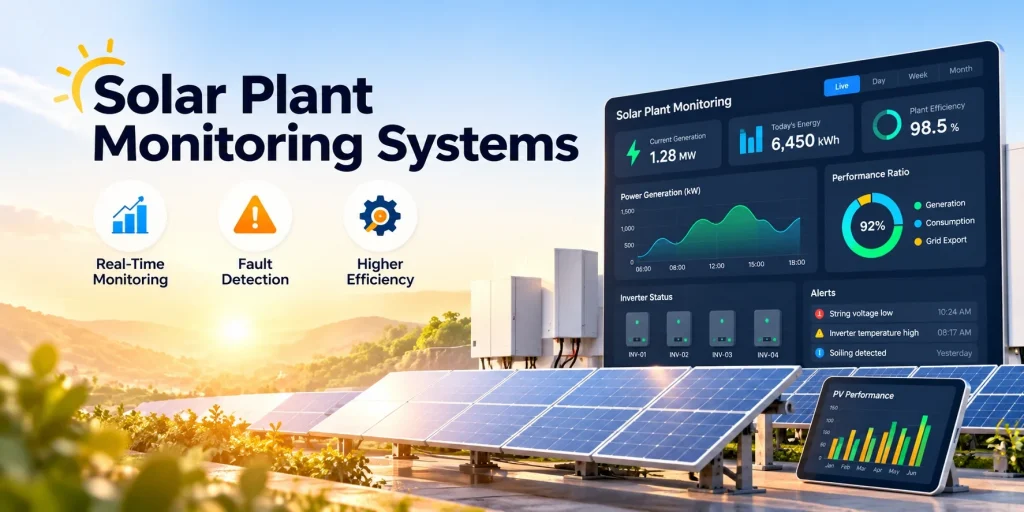
Is your solar plant generating as much energy as you expect from it? Without real-time data, even a well-built plant can lose energy every day without anyone noticing.
Most solar plant owners find out something is wrong only when the electricity bill falls short, and by then dust, a failing string or a tripping inverter may have been cutting output for weeks.
According to Research Data Field research published in Solar Energy by IIT Gandhinagar researchers (Valerino et al., 2020) revealed that uncleaned solar panels in India degrade in efficiency by 0.37% every single dry day due to airborne particulate dust. Over a month without cleaning, dust alone leads to over 11% generation loss. Combined with undetected inverter trips, thermal hotspots, and string failures, unmonitored C&I plants lose 15%–25% of their total annual generation capacity.
That is why solar plant monitoring systems have become a basic part of owning and running a PV plant. In this guide, you will learn what these systems track, how they work, how they find faults early and how they help raise plant efficiency, whether you manage a small rooftop system or a utility-scale project.
What Does a Solar Plant Monitoring System Track and How Does It Work?
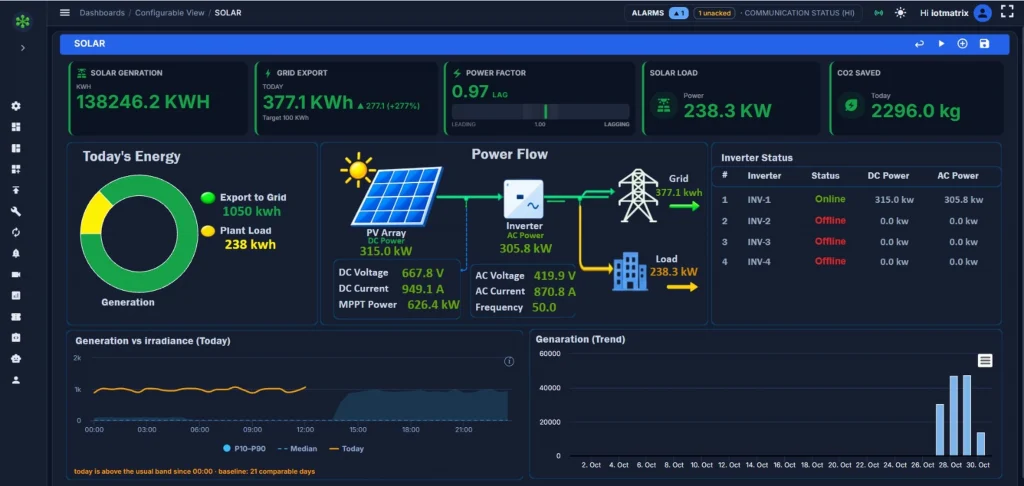
A solar plant monitoring system tracks every factor that decides how much energy a PV plant produces and how well it turns sunlight into usable power. It collects data from inverters, energy meters, string combiner boxes and weather sensors, and groups it into four areas.
- Electrical output: DC voltage and current at the inverter and string level, AC power, and energy generated per day, month, year and lifetime.
- Environmental conditions: Work on solar irradiance, module temperature, ambient temperature, humidity and wind speed.
- Equipment health: Track inverter status, internal temperature, fault codes, string combiner readings and communication links.
- Grid parameters: Analyze voltage, frequency and power factor at the point of connection, along with energy exported and consume.
Once the data is collected, the system then analyzes it by comparing actual generation with the output expected for the measured sunlight and temperature. The gap between the two shows how much energy is being lost and where. Historical analysis adds seasonal trends, long-term degradation, and the before-and-after effect of cleaning or repairs, so every maintenance decision is backed by evidence.
Is your solar plant losing energy? Find hidden losses from dust, weak strings and inverter trips before they cut your output.
Features and Capabilities of a Solar Plant Monitoring System
Not every monitoring platform is equal, and the number of data points collected matters less than what the software does with them. A capable system should offer:
Key Features of a Solar Plant Monitoring System
- Remote Monitoring and Centralized Real-Time Dashboards: View live power, energy and plant status from any device, with drill-down from plant to inverter to string and a single screen for several sites.
- Irradiance & Weather Monitoring:Uses a pyranometer and weather sensors to measure sunlight, temperature, humidity, wind and rainfall, so you can tell weather losses from real faults.
- Solar Inverter and PV String Monitoring: Tracks inverter output, status and fault codes along with string-level current, so a weak string or a tripped inverter is found quickly.
- AI-Based Anomaly Detection: Predicts expected power from weather and panel data, then separates passing cloud cover from real faults such as micro-cracks or damaged diodes. With drone thermal images, it can also spot hot spots and dust, so you get an alert weeks before a breakdown.
- Configurable Alerts and Notifications: Sends an SMS, email or app message as soon as a reading goes beyond the limits you set, and does not raise a false alarm when a passing cloud briefly lowers output.
- Automated Reports: Prepares daily, monthly and yearly reports with no manual effort. It compares energy generation, Performance Ratio (PR) and expected versus actual yield, then sends the reports by email or to the cloud as files, saving time for operators and investors.
Key Capabilities of a Solar Plant Monitoring System
Capabilities are what the system can do with that data.
- Instant Fault Detection and Root Cause Analysis: Detects faults such as inverter breakdowns or dust on panels in real time to help identify possible root causes using AI and live weather data, it pinpoints the exact location and root cause and alerts the operator by SMS or WhatsApp, saving repair time and cutting downtime.
- Multi-Brand Compatibility: Brings data from different inverter brands, energy meters, and environmental sensors to integrate by different manufacturers into a single monitoring system. into one dashboard through Modbus or APIs, so separate portals are not needed.
- Remote Multi-Site Management: Tracks and compares plants at different locations from one cloud dashboard, reducing site visits and O&M cost.
- Data Buffering and Security: Stores data locally during internet outages and syncs it to the cloud once the connection returns, while encryption and strict access control guard against cyber attacks.
- Open Integration and Analytics: Connects with Scada system through APIs to ERP and energy-management tools, and supports AI-based anomaly detection.
Challenges in Solar Plant Monitoring and Management
Managing a solar plant without proper monitoring is difficult, and owners and O&M teams commonly face these challenges:
• Manual Inspection and Reactive Maintenance: Checking a plant by hand takes time, and equipment problems are often found only after power generation drops or a machine breaks down. This causes downtime and wasted cost, and a weak string or a slowly failing part is easily missed in a manual check.
• No Real-Time Data and Hidden Energy Losses: Without real-time monitoring, there is no live data, so sudden drops in generation, inverter faults, shading and faulty connectors go unseen. Each of these cuts output a little every day, and the energy lost to low performance is not discovered in time.
• Mixed Brands and Multiple Sites: Equipment from different manufacturers and plants at different locations make it hard to bring data into one system, compare performance and prepare reports.
• Weak Connectivity and Poor Data Quality: Unreliable internet at remote sites causes data gaps, and uncalibrated sensors give misleading figures and false alarms.
• Too Many Alerts and Scattered Analytics: Alarms for every small event bury the important faults, and without Performance Ratio and CUF data, real losses are hard to measure or prove.
How Does a Solar Power Monitoring System Detect Faults and Performance Issues?
A monitoring system finds faults by checking actual output against expected output. Using on-site irradiance and temperature readings, the software works out how much power the plant should be producing at that moment and flags any gap. This matters because most PV faults do not shut a plant down. They lower output each day, and without data they stay hidden.
- Inverter faults: Trips, derating and downtime are caught through status codes and sudden drops in AC output, so repairs can start within hours instead of days.
- String underperformance: A string producing less current than its neighbours under the same sunlight points to a blown fuse, loose connector, failed bypass diode, shading or damaged modules.
- Soiling: A gradual decline in Performance Ratio (PR) between cleanings, followed by a recovery after cleaning or rain, signals dust accumulation. This is a major loss factor in dusty regions.
- Shading: A dip at the same time every day usually means a new structure, tree or piece of equipment is casting a shadow.
- Electrical anomalies: Ground-fault and insulation alarms, abnormal voltage or current, and grid-parameter deviations warn of safety and equipment risks.
- Data and communication faults: Lost connections and stuck or missing sensor values are flagged so you know the data itself can be trusted.
Which Solar PV Parameters and Performance KPIs Should Plant Operators Monitor?
Operators should track a core set of parameters and turn them into standard performance indicators.
Key parameters
- DC Voltage and Current: Measured at the inverter input and for each string to track DC and AC voltage and current to identify electrical abnormalities.
- AC Power and Energy Yield: It shows how much electricity the solar inverter supplies at a particular time (kW) and how much total electricity the solar plant generates daily or monthly (kWh).
- Solar Irradiance and Module Temperature: It measures sunlight and solar panel temperature to understand how weather conditions affect power generation.
- Inverter Status and Fault Codes: Record temperature, derating and trips, so downtime and equipment identifies problems that are caught early so it helps operators to detect faults and solve issues.
- Grid Voltage, Frequency and Power Factor: Confirm the plant is operating within grid limits at the point of connection.
Key performance indicators
- Performance Ratio (PR): Compares actual energy output with the theoretical output. Measures how efficiently a solar plant converts available sunlight into electricity compared to its expected performance.
- Capacity Utilisation Factor (CUF): Compares actual energy generated with the maximum possible at full rated capacity over a year, and is widely used for reporting in India.
- Specific Yield (kWh/kWp): Shows energy produced per installed kilowatt-peak, which makes it easy to compare plants of different sizes.
- Inverter Efficiency: Shows how effectively DC power is converted to AC, and highlights inverters that are losing energy.
- Plant Availability: Shows the percentage of time the solar plant was actually able to generate, which reflects downtime.
The IEC 61724-1 standard is a useful reference for sensor selection, accuracy classes and KPI calculation. Following it makes your figures dependable in technical audits and discussions with lenders and investors.
AI-Powered Solar Plant Monitoring for Anomaly Detection and Predictive Maintenance
AI-powered solar monitoring analyzes generation data, inverter readings, and equipment performance to identify unusual patterns. It helps operators detect potential issues, forecast solar generation, and plan maintenance before minor problems lead to extended downtime.
- Anomaly Detection: Identifies unusual generation patterns and performance deviations.
- Predictive Maintenance: Uses equipment trends and fault history to flag potential maintenance needs.
- Solar Generation Forecasting: Estimates expected output using historical data and weather information.
- Performance Analysis: Compares similar inverters or PV strings to identify underperforming equipment.
AI insights depend on data quality and system capabilities, and detected issues should be verified before corrective action.
Improving Solar Plant Efficiency, Energy Generation and Equipment Availability
Monitoring improves efficiency by making hidden losses visible and fixable. The gains come from acting on the data.
- Quicker Fault Resolution: Every hour of inverter or string downtime is lost revenue. Instant alerts and remote diagnostics can take less repair time, because technicians arrive knowing what is wrong and which spare part to bring.
- Condition-based cleaning: Link with Performance Ratio trends to cleaning events shows the best cleaning frequency for each season, so you clean when the cost of lost energy exceeds the cost of cleaning.
- Predictive maintenance: Trend data on temperatures, string drift and soiling lets teams repair equipment before it fails and plan work during low-generation periods.
- Inverter and Site Benchmarking: Comparing inverters, blocks and sites reveals underperformers that hide inside an acceptable plant average.
- Long-Term Degradation Analysis: Long-term, weather-normalised data shows whether module degradation stays within warranty limits and supports claims with evidence.
- Smarter Self-Consumption and Energy Planning : Generation and consumption data show how much solar energy a site uses, exports and still buys from the grid, helping shift loads, size batteries and cut bills.
Together, these actions raise energy yield, increase equipment availability and protect returns over the plant’s 25-year life.
What Should Commercial and Industrial PV Plants Look for in Solar Monitoring Software?
For commercial and industrial (C&I) plants, the best monitoring software is the one that fits the plant’s size, inverter mix and reporting needs. It should work with all your inverter brands and meters, show string-level data on clear dashboards, and calculate Performance Ratio, CUF and specific yield automatically. It should also send ranked alerts through SMS, email or app, and produce reports that management, lenders and auditors can use.
Beyond these basics, check that the software can combine generation and consumption data, keeps your data secure with user roles, and offers open APIs and multi-site dashboards as you grow. Also ask about sensor accuracy, local support and service commitments, because the software is only as good as the data feeding it and the team behind it.
What Makes the IOTMATRIX Solar Monitoring System Different?
Most monitoring tools give every customer the same standard dashboard. IOTMATRIX takes a different approach with its Solar Monitoring System on the MatrixIQ platform that the team first studies the plant and its operations, then designs a solution to match, and connects existing equipment through Modbus RTU/TCP, MQTT and OPC UA.
The platform shows solar generation and consumption together, brings several sites into one cloud dashboard, and uses AI-driven alerts to flag problems before they cause downtime. It also covers energy, machines, water and buildings, backed by over seven years of industrial IoT experience.
Protect Your Solar Plant’s Generation with Smart Monitoring
Small problems such as dust, weak strings or inverter trips rarely stop a solar plant, but they quietly reduce output every day. A solar plant monitoring system makes these losses visible by tracking generation, weather and equipment health, and comparing actual output with expected output. KPIs like Performance Ratio and CUF turn this data into clear measures of plant performance.
With AI-based alerts and automated reports, O&M teams can find faults early, fix them faster and plan maintenance before failures happen. For rooftop, C&I and utility-scale plants alike, smart solar plant monitoring protects energy yield and returns over the plant’s lifetime.
Ready to monitor your solar plant smarter? Find faults early and improve your solar plant’s performance.
It can. The system shows which inverter or string has a fault and where, so technicians make fewer unnecessary site visits and arrive with the right spare parts. Cleaning and repairs can also be planned from actual performance data instead of a fixed schedule. The savings depend on the plant and how the data is used.
Large plants gain plant-wide visibility across many inverters and strings, performance comparison between inverters and blocks, and automated reports. These help teams prioritise repairs, keep performance consistent across the site and reduce downtime.
It takes on-site irradiance and module temperature readings, calculates the power the plant should produce, and compares this with the actual AC output. A lasting gap, a fall in Performance Ratio, or one string producing less current than its neighbours is flagged as a possible fault. Inverter fault codes are also read and reported.
Fixed alarms trigger only at set limits. AI learns the normal behaviour of each inverter and string under different weather conditions, so it can flag small or slow changes that fixed alarms miss. It can also help tell a passing cloud from a real fault. Flagged issues should still be checked on site, and accuracy depends on data quality.
The system tracks live generation, weather and equipment data, and AI compares actual output with expected output to spot unusual drops or a slow decline. When something goes wrong, it sends an instant SMS, email or app alert naming the device and fault, while ignoring short dips such as passing clouds. The same trends help plan cleaning and repairs before a failure.
Usually, yes. Owners, O&M teams and investors need different views, so many platforms offer configurable reports. For example, operators may get daily generation and fault summaries, while investors get monthly Performance Ratio and CUF reports. Reports can often be sent automatically by email or saved in the cloud.
Yes, many platforms can. They connect through open APIs or standard protocols such as Modbus, so generation data can feed SCADA, ERP and energy-management systems. It is worth confirming which integrations a provider supports before buying.
The time depends on the plant size, the number of inverters and strings, the sensors needed and how easily the devices connect. A small plant is usually quicker than a large site with many devices. The best way to get a reliable timeline is to ask the provider after a site assessment.