
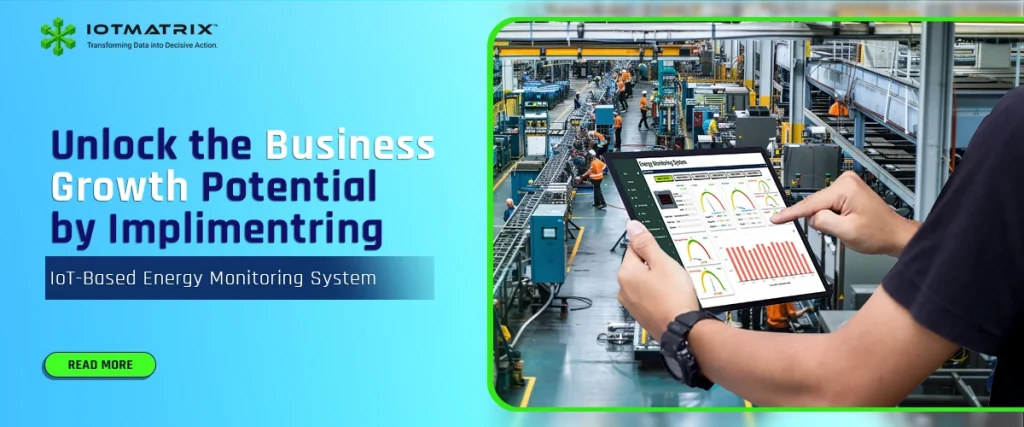
Factory operations are evolving rapidly, and companies are moving away from legacy machines toward smart manufacturing assets based on fully digital control and management. This shift saves money, time, and significantly increases production efficiency.
However, one major operational challenge remains: Companies still rely on traditional meters to know the utility consumption. This is the reason why they are unable to reduce their energy costs. Company owners never know how much energy their machines, manufacturing assets, and facilities are consuming & where energy is going to waste. They rely on manual energy audits, and only they know the energy consumption bill at the end of the month when they pay the money to the grid company, which leads to financial loss, and they overspend lakhs of rupees on utility bills that increase their operational costs and affect the profit margin.
This is exactly where an IoT-based energy monitoring system makes a massive difference in saving energy costs. It acts as a transparent, real-time window into your facility, exposing everything from raw energy consumption to insightful data. It works like magic tools that show you everything in real-time, whether it is energy consumption visibility, peak load demand, power anomalies, energy leaks, or idle time energy consumption. It enables you to monitor and track every minute and second of power usage breakdown machine-wise, department-wise, and at every circuit level across the plant.
The Invisible Leak: Why Traditional Factory Meters Are Failing Your Bottom Line
Walk onto any modern manufacturing floor today, and you will see an incredible display of operational precision and real-time analytics data. High-speed robotics, automated assembly lines, machines, and predictive supply chain working through software and digital control systems. But still, when it comes to managing utility expenses, many business owners still rely on a traditional meter approach: waiting for a monthly paper bill to find out what went wrong 30 days ago. In an operational plant, there are different types of electrical systems; relying entirely on standard utility meters means managing a major operational expense in the dark.
A traditional meter is like a digital analogue, it shows only the number of energy consumption. It never shows you how much energy your machines and electrical facilities have consumed. Also, it cannot tell you where it was wasted, why a sudden surge occurred, or which specific machine is bleeding money. To bridge this gap, manufacturers are moving away from monthly utility guesswork and implementing Industrial IoT energy monitoring systems. By installing IoT-powered systems and connected sensors across individual production lines, feeders, and heavy machinery, companies can transform energy from an uncontrollable overhead cost into a visible, manageable variable.
The True Cost of Energy Blindness
When energy data is trapped in monthly cycles, several hidden problems quietly erode your profit margins:
Phantom Loads: When the production process is completed, equipment left running on idle during shift changes, weekends, or maintenance windows can account for substantial unnoticed waste.
Unnoticed Efficiency Drift: In a plant, there are different types of machines and assets running simultaneously. For manufacturing operations, there are heavy machines working like compressors, pumps, or HVAC units that wear down, they pull significantly more power to achieve the same output. Without machine-level tracking, this gradual decline remains completely invisible.
Peak Demand Penalties: Grid companies charge utility costs for commercial electricity use differently from households. They charge massive premiums based on the single highest 15-minute spike in a billing cycle. If multiple heavy assets start up simultaneously, a facility can trigger a penalty that inflates the entire month’s bill.
Research Data: Industrial data published by researchers via MDPI Energy reveals a shocking asymmetric cost curve: just 100 hours of peak demand spikes throughout an entire year can account for 10% to 20% of a facility’s total annual electricity costs.
Performance Breakdown: Traditional Utility Meters vs. IoT-Based Systems
| Operational Aspect | Traditional Utility Meters | IoT-Based Energy Monitoring System | Typical Improvement |
|---|---|---|---|
| Data Visibility | Paper logs, manual meter rounds, and generic monthly utility bills. | Real-time, 24*7 second-by-second tracking per asset and individual machines. | Immediate transparency into the exact energy consumption of every asset, circuit, and machine. |
| Energy Consumption | Reactive reviews weeks after the utility money has already been spent. | Automated anomaly detection & live alerts sent straight to your phone. | Up to 20% to 30% reduction in overall monthly utility costs. |
| Maintenance Strategy | Fix things only after a catastrophic breakdown happens or operation shutdown. | Predictive maintenance based on power draw patterns and machine data. | 20% to 35% reduction in unexpected machinery repair costs. |
| Equipment Uptime | Unplanned breakdowns halt production. | Continuous health tracking through each machine’s unique electrical footprint. | Up to 97% asset availability, keeping your production schedules running smoothly. |
The Core Blueprint: What Exactly is an IoT-Based Energy Monitoring System?
To put it simply, an IoT-based energy monitoring system is a smart network of connected digital sensors, hardware, and software that tracks your facility’s electricity consumption in real time. It connects every machine. energy meter, CT/PT sensor, and smart device across your facility and brings all consumption data live into a single intelligent dashboard. With their advanced analytics dashboard, business owners can measure kWh, voltage, current, power factor, demand, harmonics, and other electrical parameters. The IoT-based energy monitoring system not only gives you energy consumption visibility, but it also uses an IoT sensor and ML model to identify anomalies, energy leaks, and high peak demand patterns, sends you instant live alerts straight to your phone, so you can stop energy waste, reduce bills, and prove compliance without any manual effort.
The system works seamlessly across three simple steps:
The Smart IoT Hardware: Small, non-disruptive IoT sensor nodes and smart multifunction energy meters, CT/PT sensors connected via RS485, MODBUS, or GSM/ GPRS. These are hooked directly onto your main panels, sub-panels, and heavy machinery lines. They measure raw electrical data like voltage, current, and power factor every single second. Instant Wireless Transmission: Instant Wireless Transmission: These sensors don’t store data in a dark corner. They use cloud storage and secure wireless networks like LAN, Wi-Fi, or MQTT to stream this live data instantly up to a unified IoT software dashboard like MatrixIQ. The Intelligent Dashboard: The software transforms those raw, complicated numbers into clean, easy-to-read charts, graphs, and live financial costs on your phone or computer. If a machine starts drawing too much power, or if a line is left running completely idle, the system instantly catches it and alerts your team via SMS or WhatsApp before the money is lost.
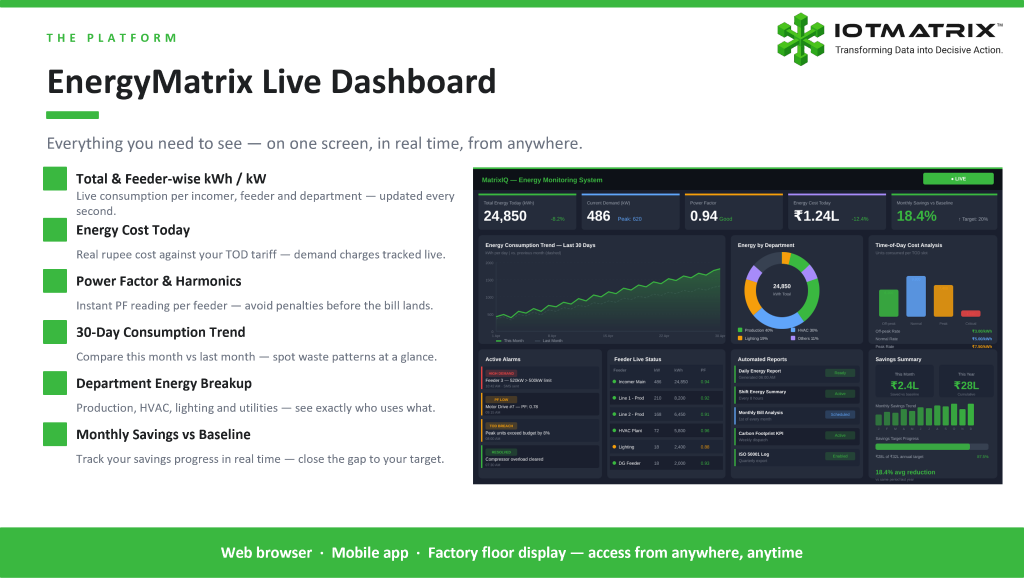
Essentially, it moves your factory away from outdated, manual clipboards and replaces them with a live, 24/7 digital dashboard that tells you exactly where every single rupee of your utility budget is going.
Let’s talk about the top benefits of energy monitoring system
5 benefits of implementing IoT-based energy monitoring system in your facility
An IoT-based energy monitoring system helps industrial facilities cut utility costs by delivering real-time, machine-level consumption visibility, reducing peak demand penalties, enabling predictive maintenance through power signature analysis, correcting poor power factor, and generating audit-ready data for ESG and ISO 50001 compliance. It typically saves 15% to 30% on annual energy costs and helps to run operations efficiently without any headache of utility costs.
1. Machine-Level Visibility That Turns One Utility Bill Into Hundreds of Data Points
When we see our traditional utility meters, It provides us exactly one number: the total kWh consumed by the entire facility, whether it is consumed by machines, pumps, compressors, or other facilities in the plant. It doesn’t show you where exactly to consume or where there is wastage. An IoT-based energy monitoring system replaces that single number with a live consumption profile for every panel, feeder, machine, air compressor, and other assets. It shows you real-time data on how many units and rupees any individual facility consumed the utility.
It is possible because CT (Current Transformer) and PT (Potential Transformer) sensors are clamped onto individual circuits, not just the main incomer and stream in real-time voltage, current, kW, kVA, kVAR, and power factor readings back to the gateway every few seconds via Modbus RTU or MQTT. Instead of asking “why was last month’s bill high,” a plant engineer can now ask “which of my 40 CNC machines is consuming 18% more power than its baseline” and get an answer instantly.
This granularity is what separates a smart energy monitoring system from a smart meter. A smart meter tells the utility company how much to charge you. A machine-level IIoT system tells you exactly why, where, and when these issues are happening and lets you act on them the same shift in real-time without affecting the operations. These instant actions not only prevent the issue, but it also saves your energy costs up to 30% and increases the profit margin.
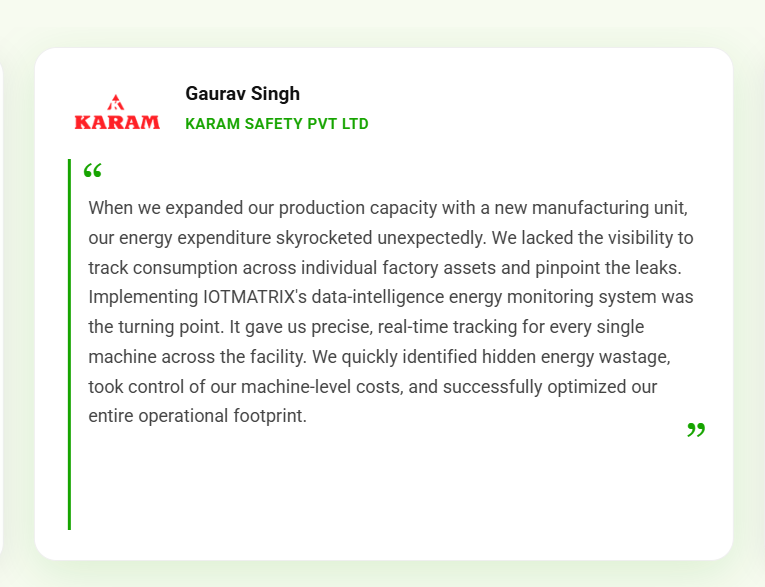
A real-world example of KARAM Safety Pvt. Ltd Company:
Karam Safety is a manufacturing company of industrial Safety products. They have different types of product designing machines and other assets in their plant. When they expanded their manufacturing unit in the same plant and added some new production lines and machines for new product designing, after that, at the end of the month, they got their utility bill from the grid company, and they were shocked when they saw the utility costs. They see their energy expenditure skyrocket unexpectedly, while they keep the same machines and equipment in the new production unit. They implement IOTMATRIX’s IoT-based energy monitoring system in their entire plant, and they audit every machine, circuit, and department where energy is consumed. They find that after individual assets monitoring, some compressors and designing CNC machines are pulling 12% more current than their rated energy consumption. They fixed these machines’ issues and energy wastage, saving their energy costs almost 25% annually.
2. Lower Peak Demand Charges Through Real-Time Load Management
In home energy consumption, grid companies charge based on how many units you use, but Industrial electricity tariffs rarely charge only for how much energy you consume. They charge for how hard you hit the grid during your worst 15-minute window in the billing cycle. This is based on your Maximum Demand (MD) or KvA demand charge, and it’s calculated independently of your total kWh usage. To cut peak demand charges, you need to make strategic plans and management that prevent high power demand.
An IoT-based energy monitoring system tracks demand in real time. It uses an ML algorithm to detect any anomalies and triggers alerts the moment when energy consumption trends toward a new peak demand or high energy surge. With automated load-shedding logic or peak demand anomaly detection alert systems, prevent these demand charges by sending WhatsApp/SMS alerts to your shift engineer to stagger machine start-ups, sequence compressors, or delay a non-critical process by a few minutes. Since demand penalties are often billed at 1.5x to 2x the normal per-unit energy rate, avoiding even two or three unnecessary peak events a month has an outsized effect on the final bill compared to the same reduction in overall kWh consumption.
3. Predictive Maintenance Through Power Signature Analysis
In manufacturing plants, every electrical machine has a power signature, a unique repeatable pattern of current draw, voltage stability, and power factor that reflects its mechanical health. When a motor bearing starts to wear, a belt slips, or a phase goes out of balance, that signature shifts before the machine ever shows an audible or visible symptom, and performance also goes down.
This is where an IoT-based energy monitoring platform relieves the headache of maintenance and helps to fix the issue without any hassle. Their system’s ML models continuously compare live power draw against each machine’s historical baseline and flag anomalies like:
Phase imbalance: Early warning of loose connections or failing windings
Harmonic distortion (THD): Spikes are often caused by aging VFDs or non-linear loads stressing the network
Gradual current creep: At constant output, the classic signature of mechanical degradation
4. Remote Asset Monitoring and Control in Real-Time
For a multi-site manufacturer, the biggest energy blind spot usually isn’t inside any single plant; it’s the distance between departments, manufacturing units, and plants. A facility head sitting at the corporate office has no way of knowing, at the moment, whether the Pune unit’s HVAC is running at full load on a Monday or whether the Chennai line’s compressor has been idling since the night shift ended. An IoT-based energy monitoring system closes that distance completely, turning every plant’s monitoring and tracking of power consumption into a hassle-free process without any complexity, regardless of location or individual manufacturing unit. It makes the power consumption visibility transparent, something you can see and act on from a unified dashboard from anywhere and at any time. This IoT-based energy monitoring software manages half the energy management work remotely, whether it is a machine, compressor, hydraulic pump, or other operational facility across the plant. Depending on the hardware layer installed, authorized personnel can:
- ✓ Remote Circuit Control: Remotely trip or reset specific circuits, shutting down a machine or a full production line left running after hours, without dispatching someone to the panel physically.
- ✓ Dynamic Threshold Adjustments: Push threshold changes on the fly, tightening an alert limit on a machine that’s shown early wear signs, from a laptop and mobile device in a different city.
- ✓ Centralized Load Scheduling: Schedule load operations remotely, staggering heavy machine start-ups across shifts to avoid a demand spike, coordinated centrally instead of relying on each site to self-manage it.
This matters most for organizations running lean maintenance teams across several locations, where a single energy manager is realistically responsible for oversight across five or six plants. Remote monitoring and control don’t just save the cost of travel and physical audits, it remove the response time between “something is wrong” and “it needs to be fixed immediately” from days to minutes, regardless of which site it happened at.
5. Autonomous Energy Waste and Fault Detection in Real-Time at the Circuit Level
Traditional factory-wide energy meters only show you how much power you used, it doesn’t show you data on where and how much energy is consumed and why power surges are happening. In this situation, you never know about your power consumption and hidden energy wastage. When you know this at the end of the month through the grid company utility bill, by then, your energy bill costs will have skyrocketed.
It establishes a baseline for normal machine behavior. The second a motor begins to fail, a compressor leaks, or a line is accidentally left running completely idle over a weekend, the system catches it autonomously. You don’t have to hunt for the problem; the dashboard instantly flags the exact circuit, quantifies the wasted energy in real-time, and shoots an alert to your maintenance team’s phone before a minor anomaly turns into a catastrophic machine breakdown or a multi-crore utility penalty.
Operational Impact on the Factory Floor:
- ✓ Granular, Pinpoint Diagnostics: Shifts monitoring from whole-facility meters down to individual electrical veins, instantly flagging anomalies on specific machine breakers.
- ✓ Proactive Waste Mitigation: Autonomously tracks asset baselines to spot power leaks, idle runtimes, or compressor issues the exact second they deviate from normal behavior.
- ✓ Preemptive Maintenance Alerts: Deliver real-time data to engineering teams, allowing them to service failing components before a minor current spike turns into an expensive breakdown.
Why is IOTMATRIX the Trusted Choice for Industrial IoT- Based Energy Monitoring System?
IOTMATRIX is a leading industrial IoT solution provider that assists manufacturing, Commercial, and processing industries with an advanced, data-driven energy monitoring platform to track power consumption quickly and accurately down to the machine-wise, department-wise, and circuit level. IOTMATRIX has a robust portfolio of industrial IoT sensors, edge gateways, and analytics tools for thorough operational visibility. Our IoT-based energy monitoring solutions perfectly suit the needs of modern production plants, ensuring a seamless deployment process and guaranteeing measurable utility savings with ease.
We provide industrial-grade energy monitoring solutions designed specifically for heavy manufacturing and industrial environments.
Sub-Millisecond High-Frequency Logging
While competitors offer delayed tracking, our systems feature direct, high-frequency data logging that captures power quality, voltage surges, and current spikes within milliseconds.
AI & Machine Learning Waste Detection
We integrate an advanced artificial intelligence and machine learning analytics module that autonomously identifies hidden “ghost” energy waste and operational anomalies with pinpoint precision.
Advanced Edge Computing & Carbon Tracking
Our platform utilizes cutting-edge edge computing combined with cloud analytics to calculate true machine efficiency and carbon footprints in real-time.
Non-Disruptive Plug-and-Play IoT Architecture
iotmatrix deploys a proprietary, non-invasive plug-and-play architecture that guarantees minimum installation downtime without disrupting active production lines.
Industrial-Grade Ruggedised Hardware
Built for extreme environments, our hardware components are industrially certified to withstand harsh, high-temperature, and high-vibration factory floor conditions that break standard sensors.
Effortless ERP & SCADA Interoperability
Our highly intuitive, web-based dashboard features open API protocols that integrate effortlessly with your existing enterprise ERP and legacy SCADA systems.
Multi-Facility Global Benchmarking
Our secure cloud platform supports advanced multi-facility reporting, allowing corporate energy managers to track, compare, and benchmark consumption across global plant locations from a single screen.
Heavy Industrial Customization
We do not offer generic, one-size-fits-all software; we provide heavily customized energy monitoring configurations engineered specifically for complex manufacturing environments.
Industry-Leading Data Accuracy
Engineered for precision-critical sectors, our monitoring systems deliver the highest certified data accuracy rates in the industrial automation industry.
Infinite Scalability Across Hundreds of Assets
Our scalable IoT network allows you to seamlessly expand your tracking infrastructure across hundreds of critical factory assets and new production lines without performance degradation.