
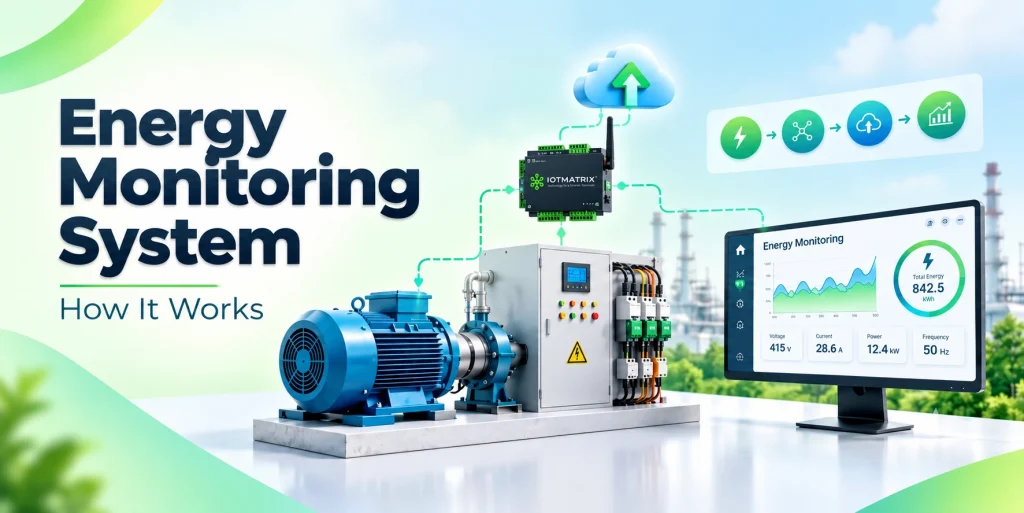
Do you actually know which machine, zone, operational cycle in your facility uses the most electricity right now? If you stop to think about it, you’re paying hidden costs that’s the problem. Most factory and building owners only find out after the bill arrives, when it’s too late to do anything but pay it.
An energy monitoring system solves this by showing you power usage as it happens not at month-end. You can see exactly which machine is using how much power your facilities consumed. Think of it like switching from a yearly report card to a live dashboard that shows your operation’s electricity use, running 24/7. And you don’t even need to read charts to make sense of it. Just ask your dashboard’s built-in AI chatbot something simple, like “which machine used the most power today?” and get an instant, easy answer, just like chatting with any other AI app.
You can know everything on the shop-floor about your energy consumption on micro-level whether it is machine wise, circuit level and department wise.
What Is an Energy Monitoring System?
An energy monitoring system is a combination of hardware sensors, smart plugs and strips, communication infrastructure, and software that continuously tracks how electricity is consumed across a facility and turns that data into real-time, actionable insight instead of showing a monthly bill.
To understand why this matters, compare it to your household electricity bill. That bill tells you the total amount owed for the month, but it doesn’t tell you whether your air conditioner, refrigerator, or water heater is responsible for the bulk of that cost. Now scale that same problem up to an entire factory with dozens or hundreds of machines, and the challenge becomes far more serious. Without micro-level metrics, a facility manager is essentially thinking about which equipment to investigate when costs rise.
But modern energy monitoring goes far beyond just tracking usage. Today’s systems capture live consumption data, peak-load patterns, power surges, and operational trends as they happen. On top of this, AI-powered anomaly detection learns your facility’s normal energy behavior and instantly flags anything unusual: a power spike, a leak, or a machine consuming more power than it should.
This connected sensor network, often extending down to individual smart plugs and strips and up to smart grid integration, essentially acts as the nervous system of a modern Energy Management System (EMS), bridging physical electrical infrastructure with cloud-based AI analytics.
Energy Monitoring and Industry 4.0
Industry 4.0 means connected, data-driven factories, and an EMS is their energy layer. IIoT sensors and gateways send energy data over the same network as production data, and linking it to output shows energy per unit produced, not just total kWh. Dashboards and alerts allow immediate action instead of monthly overview, while energy signatures flag early motor, compressor, or bearing problems before they cause downtime. Digital carbon tracking also supports ESG goals.
How Circuit-Level Monitoring Beats a Traditional Electricity Meter
| Feature | Regular Electricity Meter | Energy Monitoring System |
|---|---|---|
| What it shows | One total number (billing period) | Live, continuous, real-time data |
| Level of detail | Whole facility only | Circuit-level monitoring (machine, panel, department level) |
| Monitoring intervals | Monthly | Real-time / continuous, 24×7 |
| Identifies source of waste | No | Yes, pinpoints exact machine/line |
| Detects issues (spikes, leaks) | No | Yes, with instant alerts |
| Reading point | Main incomer only | Circuit-level monitoring across sub-circuits & machines |
| Actionability | Know the cost, not the cause | Know the cost and the cause |
| Best for | Billing purposes | Cost-saving, downtime prevention, efficiency |
| Monitored utilities | Grid electricity only | Multi-utility energy monitoring: electricity, solar, DG, etc. |
Why Do Industries Need an Energy Monitoring System?
1. The Hidden Cost of Unmonitored Energy Use
Electricity is one of the highest operating costs in a manufacturing facility and unlike raw materials, most of that spend is waste, not productive use. The problem is, this waste stays invisible without granular measurement. That’s why facilities using circuit-level monitoring commonly reveal 20–30% in avoidable electricity costs within the first year simply by finally being able to see where it’s going.
This becomes possible through end-to-end energy consumption data means continuous, granular measurement across a facility’s entire power distribution from the main power supply down to individual circuits and machines monitoring voltage, current, power factor, and load at every point, with no gaps in visibility, automated energy management that acts on issues instead of just logging them, and AI-powered analytics with a built-in chatbot so you can just ask where are we losing energy? and get an instant answer, no graphs/report required.
2. Peak Demand Charges and How They Quietly Add to Your Utility Bills
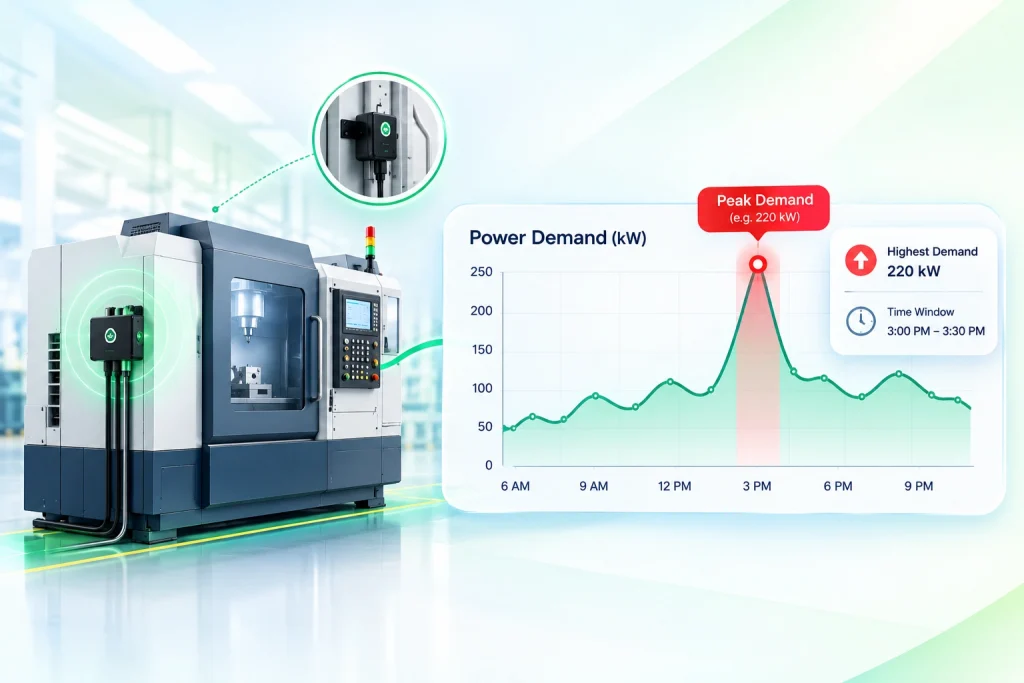
Utilities don’t just bill for total consumption they also charge for peak demand, The highest level of power demand recorded during a short window (often 15–30 minutes) in a billing cycle. Even a brief increase in demand, such as several large machines starting simultaneously, can determine the demand charge for the entire month, and without real-time visibility, it stays invisible until it hits the invoice.
The fix: Real-time alerts let you stagger start-ups or shift loads to off-peak hours
Cause: Multiple high-load machines starting simultaneously so built mechanical and technical issue
Measured as: Highest demand in a short window (kW/kVA)
Cost impact: One spike sets the charge for the whole cycle
Why it’s missed: No circuit-level monitoring = no early warning defined
3. Detect Power Quality Problems Before They Affect Operations
An energy monitoring system continuously monitors key electrical parameters 24/7. It doesn’t just tell you how much electricity is being used, it identifies the underlying issues, flagging power quality problems that could risk production lines, increase energy consumption, or shorten the operational life of critical assets.
Common issues include:
- Voltage Imbalance – A Short-term period voltage drops that are often enough to cause unexpected downtime, reset PLCs, disrupt automated processes, or interrupt a production run entirely.
- Harmonics – Distortion in the electrical waveform that makes motors, transformers, and other equipment is overheating beyond safe operating limits.
- Voltage Transients – Short, sudden spikes caused by switching events or lightning can stress precise electronic components.
- Voltage Flicker – Rapid voltage fluctuations that interfere with control systems and impact connected equipment performance.
4. Idle Equipment and Phantom Loads: The Waste You Never See
Equipment left powered on while not producing anything is one of the most common and most fixable sources of industrial energy waste. The problem is, it’s only fixable if someone can actually see it happening. Without machine-level visibility, this idle time blends invisibly into the total facility load, quietly adding up month after month.
Compliance, ESG, and Carbon Reporting
Regulations, customer requirements, and ESG commitments are making it necessary for manufacturers to track energy use and emissions with real accuracy not estimates. An energy monitoring system provides the audit-ready data needed for energy audits, ISO 50001 programs, and carbon (Scope 2) reporting.
In India, this ties directly to the BEE PAT (Perform, Achieve and Trade) scheme, which sets energy benchmarks for large industrial units. With circuit-level data approached, meeting these targets and staying audit-ready becomes much simpler than trying it together from monthly bills.
What Are the Benefits of an Energy Monitoring System?
- Reduced utility cost by identifying waste, idle loads, and underperforming assets.
- Avoided peak demand charges through load management and real-time alerts.
- Better power quality and fewer breakdowns through early detection of electrical issues.
- Predictive maintenance: spot abnormal current or temperature trends before equipment fails.
- Accurate cost allocation by department, line, or product through sub-metering system.
- Reduced carbon footprint with automated net zero emissions tracking.
- Immediate decisions with live dashboards and AI-driven (chatbots) insights.
- Audit and compliance readiness with automated, traceable reports.
Industrial Energy Monitoring System vs. Energy Monitoring Devices
This is a common source of confusion, so let’s break it down simply.
An energy monitoring device (a smart meter, clamp meter, or plug-in monitor) measures electrical values at one point. An industrial energy monitoring system combines many devices with gateways, software, analytics, and integrations into a complete solution.
| Aspect | Energy Monitoring Device | Industrial Energy Monitoring System |
|---|---|---|
| Scope | Single point or single machine | Entire facility or multiple sites |
| Components | Meter or sensor only | Sensors, gateways, cloud/software, analytics, alerts |
| Data use | Local display or basic logging | Centralized dashboards, trends, and reports |
| Analytics | Minimal or none | AI-driven anomaly detection, forecasting, benchmarking |
| Alerts | Limited | Automated real-time alerts |
| Integration | Standalone | Works with SCADA, PLCs, ERP, and BMS |
| Scalability | Limited | Scales from one unit to many plants |
| Outcome | Shows a reading | Drives decisions and savings |
How Does an Energy Monitoring System Work? Step by Step
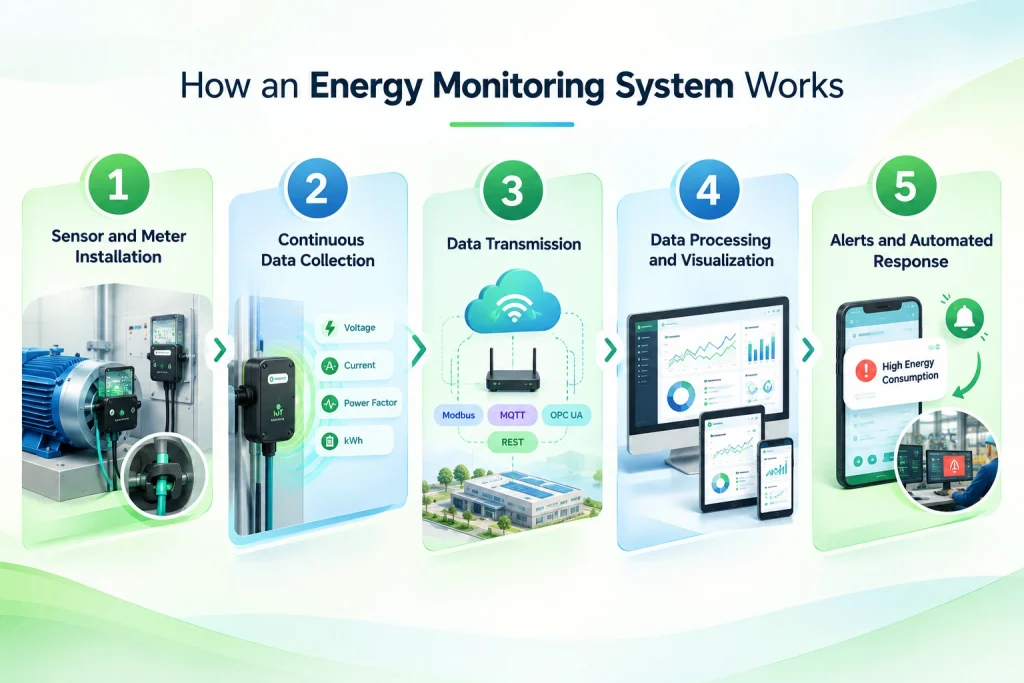
Step 1: Sensor and Meter Installation
The process begins with physically installing sensors, smart meters, or current transformers onto individual machines, distribution panels, or specific circuits within a facility without disturbing or compromising the facility’s secure electrical wiring. One of the most practical advantages of modern systems is that they can typically be added to your current setup. This means a 15-year-old machine with no digital display of any kind can still be monitored, a sensor is simply attached externally to measure its electricity consumption, without requiring the machine itself to be replaced or upgraded.
Step 2: Continuous Data Collection
Once installed, IoT sensors continuously measure critical electrical parameters including voltage, current, power factor, and cumulative kWh consumption multiple times per second. Operating in parallel, real-time AI runs alongside this in real time, learning each machine’s normal behavior so it can instantly catch anything unusual.
Step 3: Data Transmission
The data collected by each sensor are then transmitted to a central software platform. This typically happens over the facility’s existing internet connection or through a dedicated IoT communication protocol, common examples include Modbus, MQTT, OPC UA and others like REST based on the type of equipment and the maturity of the electrical infrastructure involved.
Step 4: Data Processing and Visualization
Once the raw data reaches the software platform, it’s processed and converted into a reading format so it can be understood through graphs, trend lines, and summary figures displayed on a dashboard accessible from a computer, tablet, or smartphone. This is the stage where raw electrical readings become genuinely useful information. A facility manager can open the dashboard and immediately see which machine consumed the most power yesterday, how this week’s usage compares to last week’s, or which department is responsible for a sudden spike in the bill.
Step 5: Alerts and Automated Response
The final most valuable stage is where an EMS shifts from being purely informative to genuinely proactive. A live dashboard displays consumption, cost, and trends, while automated alerts notify the right people the moment something abnormal happens not weeks later in a report. This allows staff to investigate and respond while the issue is still minor, rather than analyzing it only after a machine has failed or a utility bill arrived as higher than expected.
What Is the Architecture Behind an Energy Monitoring System?
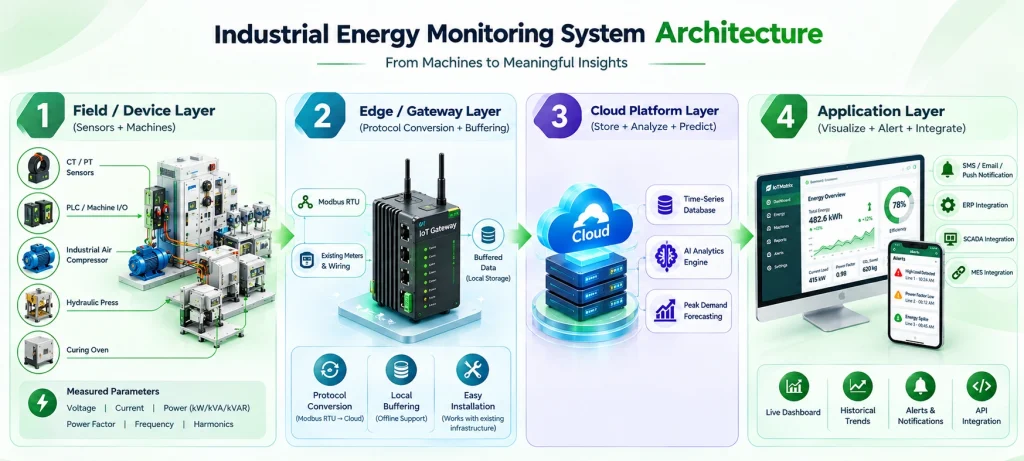
A production-grade energy monitoring system, meaning one built for real, ongoing use in an actual factory, not just a demo or prototype, is made up of four distinct layers, each handling a specific part of the process. Together, these layers let you monitor consumption data and visualize it in real time through a software dashboard, making it easy to spot exactly where something needs to change whether that’s fixing a spike, correcting inefficient usage, or adjusting a machine’s operation before it starts costing you more.
Layer 1 – Field / Device Layer
CT/PT sensors clamp directly onto individual sub-circuits rather than only the main receiver, the design choice that determines whether the rest of the system can deliver machine-level insight or just one blended number. PLCs and machine I/O contribute production context running/idle/stopped status, cycle counts which gets correlated against energy data later, so a spike can be tied to actual output, not just a raw kWh figure. Typical parameters measured here: voltage, current, power (kW/kVA/kVAR), power factor, frequency, and harmonics.
Layer 2 – Edge / Gateway Layer
Raw sensor signals aren’t cloud-ready on their own. The IoT gateway handles protocol conversion translating Modbus RTU, common on legacy equipment, into formats the cloud can ingest and buffers data locally if connectivity drops, so a network outage causes a delay rather than a permanent data gap. This layer is also what allows fast, low-disruption installation, since it works with existing meters and wiring instead of requiring new infrastructure.
Layer 3 – Cloud Platform Layer
This is where raw telemetry becomes intelligence. Incoming data lands in a time-series database designed for high-frequency writes; a reading every few seconds across hundreds of circuits adds up fast, and a standard database isn’t built for that pattern. An AI-driven analytics engine then runs continuously on top of this data, detecting patterns a person manually watching dashboards would likely miss: a slow current drift, a gradually degrading power factor, a load profile that no longer matches historical norms. This layer is also where peak-demand forecasting happens, warning a team before a spike occurs rather than after it’s already been billed.
Layer 4 – Application Layer
The layer people actually interact with. Web and mobile dashboards present live KPIs and historical trends by plant, department, and machine. Alerts fire via SMS, email, and push notification the moment something abnormal is detected. REST API integrations connect the platform into ERP, SCADA, and MES systems, so energy data isn’t isolated from production and financial data because in most facilities, energy cost is ultimately a production-planning input, not just a facilities concern.
Which Industrial Protocols Does It Use? (Modbus, MQTT, OPC UA)
Support for multiple standard protocols is what allows the system to plug into infrastructure that already exists on a factory floor:
- Modbus RTU/TCP: The most common protocol on legacy industrial meters and PLCs.
- MQTT: A lightweight messaging protocol well suited to streaming sensor data to the cloud.
- OPC UA: A modern, secure protocol widely used for interoperability between industrial systems.
- Other protocols worth mentioning: BACnet (building systems), and REST APIs (for software integrations).
Why Businesses Actually Need This
Direct Cost Reduction
Businesses typically reduce their electricity costs by 15-30% after implementing an energy monitoring system, once previously invisible sources of waste, such as a machine left running overnight, a motor drawing excess current due to a fault, or an HVAC system cycling inefficiently, are identified and corrected. This isn’t a one-time saving either; ongoing visibility means new sources of waste are caught as they emerge, rather than accumulating unnoticed for months.
Early Fault Detection
Electrical anomalies are frequently among the earliest warning signs of a developing mechanical problem. A motor that gradually draws more current than its historical baseline may be experiencing bearing wear, misalignment, or overheating, issues that, if left unaddressed, can escalate into a complete breakdown requiring far more expensive emergency repairs. Because an EMS is watching this data continuously, it often catches these patterns weeks before a technician would notice through a routine physical inspection.
Better Budgeting and Capital Planning
With granular, machine-level data available, both facility and finance teams can forecast energy costs with far greater accuracy and make informed decisions about which equipment genuinely needs to be repaired, replaced, or upgraded first, based on actual consumption patterns rather than assumptions or anecdotal experience.
Sustainability and Compliance
As more industries come under regulatory rules requiring accurate energy usage and carbon emissions reporting, whether from government bodies, corporate clients, or investors, automated, continuously collected data makes sustainability reporting significantly easier and considerably more credible than manual, estimate-based approaches.
Operational Accountability
When energy data becomes visible across different shifts day/night, departments, and individual pieces of equipment, it naturally tends to encourage more responsible usage. Teams become noticeably more conscious about switching off idle machines or flagging anomalies once they know that usage is being actively tracked and reviewed.
Does It Work with Existing SCADA, Meters, and ERP Systems?
Yes. Modern systems are designed to layer on top of what you already have.
Integration with Legacy SCADA and PLCs
Using protocols like Modbus and OPC UA, an EMS can read data from existing meters, PLCs, and SCADA systems and share data back through APIs, so there is no need to replace your current setup.
No Major Disruption to Daily Operations
Clamp-on CTs and wireless sensors can be installed without long shutdowns, and installation is usually phased to avoid disrupting production.
Scaling from One Unit to an Entire Facility
Start with a single line or high-consumption area, prove the results, and then expand to the whole plant or multiple sites on the same platform.
How IOTMATRIX Brings the Future of Energy Monitoring to Your Plant
IOTMATRIX’s EnergyMatrix platform is built around the same technologies shaping the future of industrial energy monitoring combining AI-driven insights, real-time visibility, and scalable architecture into one unified system, so you don’t have to piece together multiple tools to get there.
Latest Advancements in Energy Monitoring Systems
- AI and machine learning: Automated anomaly detection, load forecasting, and root-cause suggestions.
- Conversational analytics: Chatbot-style interfaces where you ask questions in plain language.
- Edge computing: Local processing for faster response and resilience during network outages.
- Wireless and low-power sensors: Faster, cheaper installation, especially in retrofit projects.
- Digital twins: Virtual models of plants used to simulate energy-saving scenarios.
- Predictive maintenance: Using electrical signatures to forecast equipment failures.
- Renewables, EV, and battery integration: Monitoring solar, storage, and EV charging alongside grid consumption.
- Automated carbon accounting: Real-time emissions tracking and ESG reporting.
- Cybersecurity: Encrypted communication and role-based access, which is now a major buying criterion.
Real Results

Real-time monitoring across 8 boilers and 12 machines helped Namaste India catch 459 abnormal power events and trace 100% of stoppages to an exact cause, replacing manual guesswork with precise, actionable data. By monitoring real-time data and energy leaks, Namaste India got 15-20% on Utility costs annually.
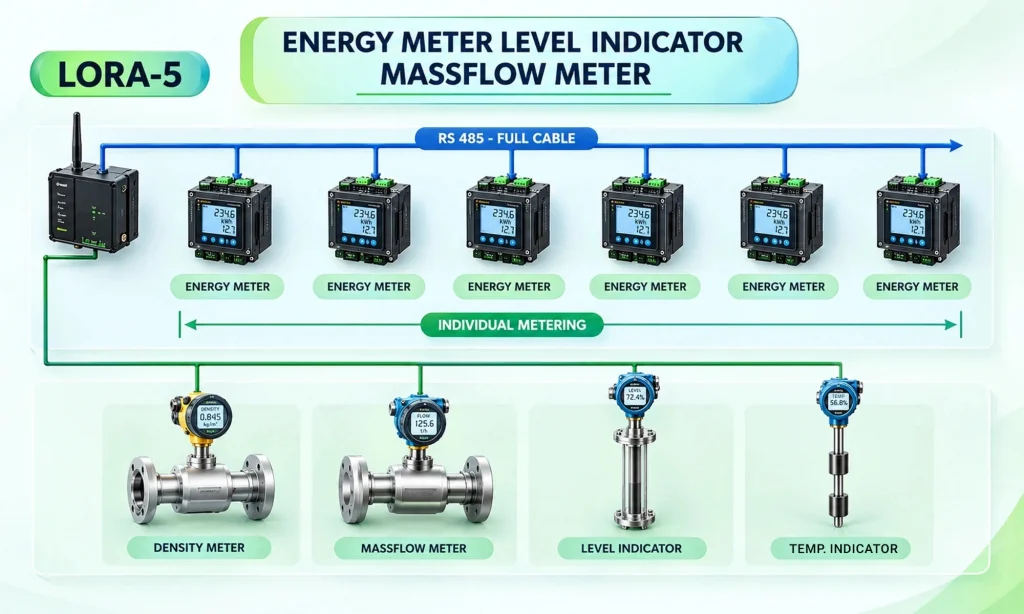
In practice, this looks like the setup above: each machine or line gets its own dedicated energy meter, wired over RS-485, while a LoRa-5 wireless gateway consolidates readings from every meter, along with density, massflow, and level sensors, into one live feed. This is what individual metering actually means in the field layer described earlier, not one shared reading for the whole facility, but a separate, addressable data point for every asset.
The Full Picture on Energy Monitoring Systems
An energy monitoring system gives industries what a traditional meter never could: complete visibility into where electricity actually goes, not just how much was used. By placing CT/PT sensors at the circuit and machine level, sending that data through an IoT gateway, and processing it in the cloud with AI-driven analytics, the system turns a single, complex monthly bill into a live, traceable picture showing exactly which machine, shift, or department is responsible for every rupee spent.
This is what separates real monitoring from simple metering: it doesn’t just report what happened, it flags problems as they’re happening, from a developing voltage imbalance to a load pattern that’s quietly setting up next month’s peak demand charge.
The impact goes well beyond a lower electricity bill. Facilities gain fewer breakdowns through early detection of power quality issues, predictive maintenance that catches failing equipment before it fails, accurate cost allocation across departments and product lines, and audit-ready compliance data that used to take hours to compile manually. It also fits into infrastructure that already exists, working alongside legacy SCADA, PLCs, and meters over standard protocols like Modbus, MQTT, and OPC UA, so adopting it doesn’t mean ripping anything out.
Frequently Asked Questions
It’s a system of sensors, connectivity, and software that tracks electricity use in real time at the circuit and machine level, showing exactly where power is going instead of just a single combined number on a monthly bill.
Most facilities identify 20 to 30 percent in avoidable electricity costs by catching idle machinery, phantom loads, and peak demand spikes that were previously invisible.
This is fully scalable, from a handful of circuits in a single panel to hundreds of measurement points across an entire facility, all visible on one dashboard.
Yes. Industrial systems are built to handle three-phase industrial supply as standard, alongside single-phase circuits where needed for smaller loads or sub-panels.
Yes. It’s built to integrate with your existing infrastructure, including current meters, PLCs, and SCADA systems, using standard industrial protocols like Modbus, MQTT, and OPC UA, so no major rework or equipment replacement is required.
Yes. Dashboards are typically available as both web and mobile apps, so consumption, alerts, and reports can be checked from anywhere, not just on-site.
Yes, for small-scale or prototype use. ESP32’s built-in Wi-Fi and processing power make it suitable for reading a CT sensor and sending data to the cloud via MQTT or HTTP. For industrial deployments, this is replaced by dedicated CT/PT sensors, industrial gateways, and protocols like Modbus or MQTT built for accuracy and 24×7 reliability at scale.
Yes. The software is designed to work alongside your existing machines and infrastructure, so you don’t need to replace what’s already installed. It integrates with your current setup, whether that’s older meters, PLCs, or SCADA systems, rather than requiring a full hardware swap.