
Digitalisation is rapidly evolving across the industry; whether it is the manufacturing or service industry, all are adopting digital technology aggressively and modernising their factory operations, but one major thing that companies still rely on is the traditional energy meter that provides only one number for electricity consumption at the end of the month for the entire facility. This is a major financial loss and drains their profit margin, as companies never know what is happening behind the high utility bill. A traditional energy meter only records one number for total electricity consumed in a billing cycle.
This is where a smart and advanced IoT energy monitoring software breaks the rule for knowing energy consumption. It makes end-to-end energy consumption transparent and trackable in real-time. An IoT-based smart energy monitoring system tracks consumption in real time, at the machine and circuit level, revealing exactly where, when, and why energy is being wasted. The difference isn’t just visibility; it’s the peak demand penalties, phantom loads, and equipment degradation that a monthly meter reading cannot detect until the damage is already done. This is the quiet limitation almost every industrial facility runs on without realising it.
A traditional energy meter isn’t broken, and it isn’t lying to you. It is designed to know only the utility bill. The grid company decides how much the whole plant consumes electricity this cycle. Still, when you actually need the answer—which machine, shift, and which hour have high power demand—it never knows this answer. This is the main gap and blind spot that can save you lakhs of rupees every month if you know this data exactly.
Traditional Energy Meter: What It Measures vs. What It Hides
In a factory or commercial building, we have seen that a traditional energy meter provides a single, aggregate monthly electricity consumption number (kWh) after billing cycles end, just like a digital meter. If we want to see exact energy uses, it doesn’t provide the visibility into asset-level efficiency or real-time power draw. Its sole purpose is to measure total cumulative energy consumption (measured in kilowatt-hours, or kWh) across an entire building or plant over a billing cycle. Even when the meter is digital and technically “smart” enough to store interval data internally, factory owners never access that raw electricity consumption data.
Key Characteristics of Traditional Meters:
- Aggregate Data: Measures the total power draw of the entire facility without breaking down usage by machine, floor, or shift.
- Old Data: Delivers usage figures days or weeks after power has already been consumed.
- No Anomaly Detection: Cannot detect phase imbalances, uncalibrated motors, or idle power consumption (“ghost loads”).
What Is the Blind Spot in Traditional Meters and Why?
- Collapses Three Phases Into One Number: Your bill shows one combined kWh figure, even though industrial power runs on three phases. If one phase is overloaded—often an early sign of a failing motor—the total still looks normal, and the problem stays hidden.
- Bills on a 15-Minute Window You’ve Never Seen: Peak demand charges are based on your highest average load in a short window, usually 15 minutes. If a few machines start together, you can get pushed into a higher penalty slab, but you’ll only see the final number weeks later with no way to trace what caused it.
- Doesn’t Trace Reactive Power Back to Its Source: Power factor penalties often show up as one lump charge on your bill. But a traditional meter can’t tell you which machine caused it; you just pay the penalty with no visibility into the reason.
- Drifts Out of Calibration Silently: Meters slowly lose accuracy over years of use, especially in plants with heavy VFD or motor loads. This drift happens quietly, so your baseline usage may already be wrong.
What Is an IoT Energy Monitoring System?
An Industrial IoT energy monitoring system is a combined network of connected sensors, meters, and software that is capable of tracking a facility’s end-to-end circuit, machine, and phase-level electricity consumption in real-time. Instead of relying on a single monthly total electricity consumption figure, business owners can know everything about energy consumption on a micro-level. CT/PT sensors clamp into panels and equipment, capture readings like voltage, current, power factor, and demand every few seconds, and transmit that data via Modbus, MQTT, or GSM/GPRS to a cloud-based energy monitoring dashboard for live alerts, trends, and actionable reports.
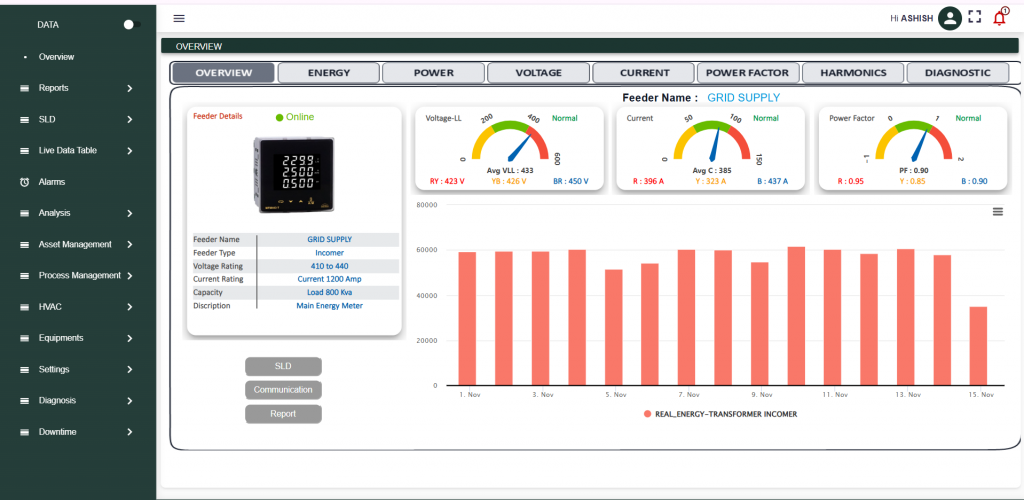
Key Features of an Energy Monitoring System
- Circuit-Level Sub-Metering: Isolates exact energy metrics for specific assets (e.g., CNC machines, HVAC units, chillers, compressors).
- Sub-Second Streaming: Transmits parameters like Voltage, Current, kW, kVA, kVAR, and Power Factor securely via industrial protocols like Modbus RTU and MQTT.
- Automated AI Analytics: Uses machine learning baselines to trigger instant alerts for threshold breaches, power spikes, and mechanical wear.
- Remote Operations Management & Control: Cloud-hosted dashboards allow you to monitor live streams, adjust alert thresholds, and safely toggle connected control relays via mobile or desktop.
- Automated Peak Demand & Load Management: Eliminates expensive Max Demand (MD) penalty charges from your discom bill by optimizing machine load distribution.
- Comprehensive Multi-Utility Integration: Integrates seamlessly with digital water flow meters, gas lines, and steam sensors, unifying all consumption data into one dashboard.
Traditional Meter vs. IoT Energy Monitoring System: A Direct Comparison
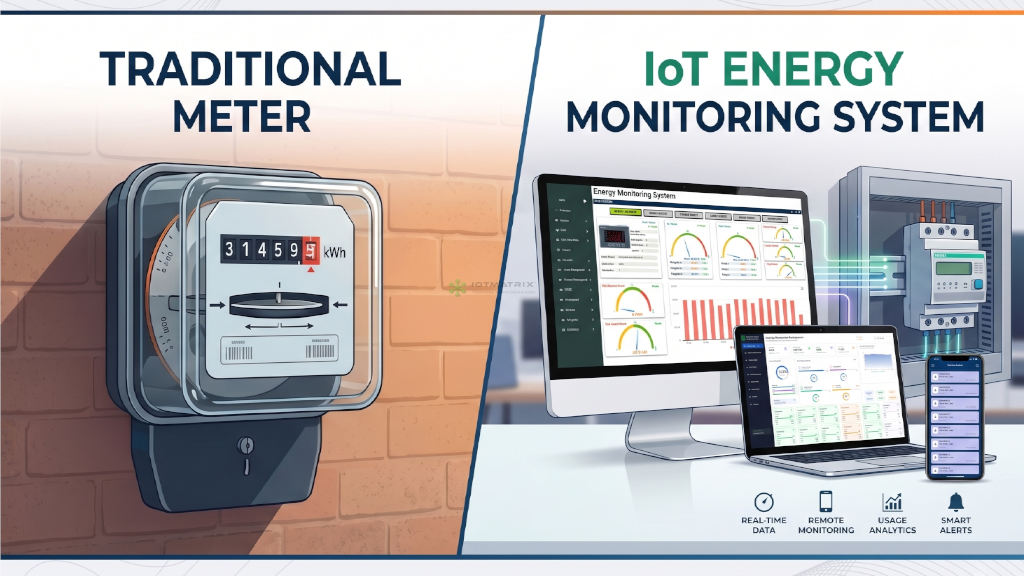
| Operational Capability | Traditional Energy Meter | IoT Energy Monitoring System |
|---|---|---|
| Data Granularity | Single combined billing number for entire facility electricity consumption | Individual readings per machine, circuit, and phase, updated every few seconds |
| Reporting Frequency | Problems surface only when the bill arrives, typically 30 days later | Anomalies are flagged at the moment they happen, often within minutes |
| Peak Demand Management | Reactive (Discovered after penalty is billed) | Automated real-time alerts & load shedding |
| Utility Scope | Electricity only | Multi-utility monitoring (Electricity, Water, Gas, Steam) |
| Power Factor Tracking | Penalty appears as a single lump adjustment with no source data | Power factor is tracked per load, making the exact cause identifiable |
| Maintenance Insights | No maintenance or fault detection capability until a breakdown occurs | Power signature analysis flags early signs of motor and equipment degradation |
| Remote Management & Control | Zero capability (Requires manual site visits & physical inspection) | 24/7 Mobile/Cloud Access (Remote relay tripping, parameter setting & multi-site control) |
| Compliance & Reporting | Requires manual data reconstruction from bills and logbooks for audits | All required data is available on demand for ISO 50001, BRSR, or ESG reporting |
What Your Factory Is Losing Every Month with Traditional Meters
Many manufacturing plants and commercial facilities still rely on standard utility meters to track their electricity usage. Relying on these legacy meters creates major operational blind spots, costing facilities lakhs of rupees every month in invisible energy leaks and quietly draining profit margins.
Here are the three primary financial leaks traditional meters hide:
1. Max Peak Demand (MD) Discom Penalties
A grid company imposes heavy surcharge penalties when a facility exceeds its contract demand limit, even for a brief 15-minute window. A traditional meter only shows that a breach occurred after the bill arrives. An IoT system tracks live demand curves and sends real-time alerts before limits are breached, allowing teams to shift non-critical loads automatically.
2. “Ghost Loads” and Off-Shift Idle Waste
In manufacturing plants, heavy machinery left idling on unstaffed floors consumes substantial electricity. Because traditional meters aggregate all facility power, this idle draw blends into total consumption. IoT sub-metering isolates exact off-shift usage per machine, enabling automated or remote relay shut-offs without a physical visit.
3. Machine Inefficiencies and Impending Failures
When a motor, pump, or compressor starts failing, its electrical draw spikes due to friction, phase imbalance, or poor power factor. Traditional meters hide these micro-anomalies inside total facility consumption. An IoT system flags these issues immediately, allowing engineering teams to perform predictive maintenance days before a breakdown stops the production lines.
Is Upgrading From a Traditional Meter to a Smart Energy Monitoring System Worth It?
A traditional electronic meter is adequate for household utility bills because residential meters only need to measure total monthly kWh. Factories and commercial spaces face complex structures that penalise them for how quickly they pull power from the grid and how efficiently their machinery runs. Relying on standard meters leaves leadership in the dark. Shifting from a traditional power meter to industrial energy monitoring software is an essential step to lower operational costs and safeguard margins.
- Avoid Discom Surge Penalties: An IoT energy monitoring system alerts you in real time so your team can shut down non-essential equipment before surge limits are breached.
- Pinpoint Hidden Power Leaks: See energy line by line, circuit level, machine level, and department-wise instead of an ambiguous total plant number.
- Prevent Machinery Breakdowns: Catch subtle current spikes, heating issues, and motor anomalies early to execute predictive maintenance before downtime strikes.
- 24/7 Plant-Wide Remote Control: Monitor live telemetry and toggle connected control relays directly from your phone or laptop.
A Real-World Case Study: Rahul Wire Pvt Ltd
Rahul Wire’s Operational Challenges
Rahul Wire operates a manufacturing facility running 14 bunching machines powered off a single 415V / 1,600A incomer. Like most plants running multiple shifts, management had zero visibility into machine-level power draw. Idle equipment burned electricity during unmonitored night shifts, unexpected utility bill surges occurred without clear reasons, and motors failed unexpectedly without early warnings.
The IOTMATRIX Solution
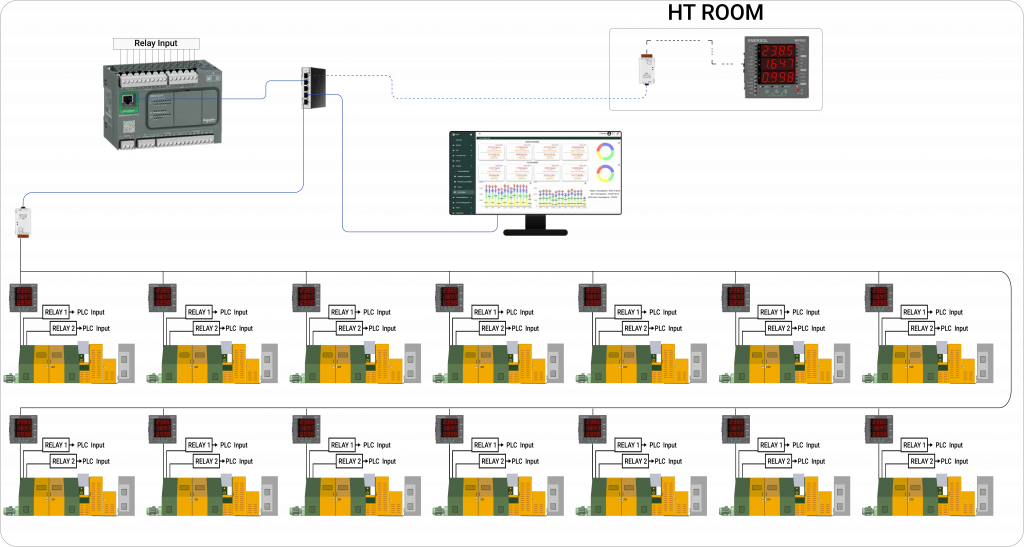
The IOTMATRIX team audited the entire plant’s energy consumption and engineered a streamlined monitoring architecture. IOTMATRIX installed PLC relay controllers, sub-meters, CT/PT sensors, and automated peak demand guardrails across their entire fleet. Telemetry from individual machines, compressors, chillers, and distribution lines was channelled directly into a unified cloud dashboard, giving management live circuit-wise and machine-wise metrics.
Measurable Impact: What Changed After Rahul Wire Deployed IOTMATRIX’s System
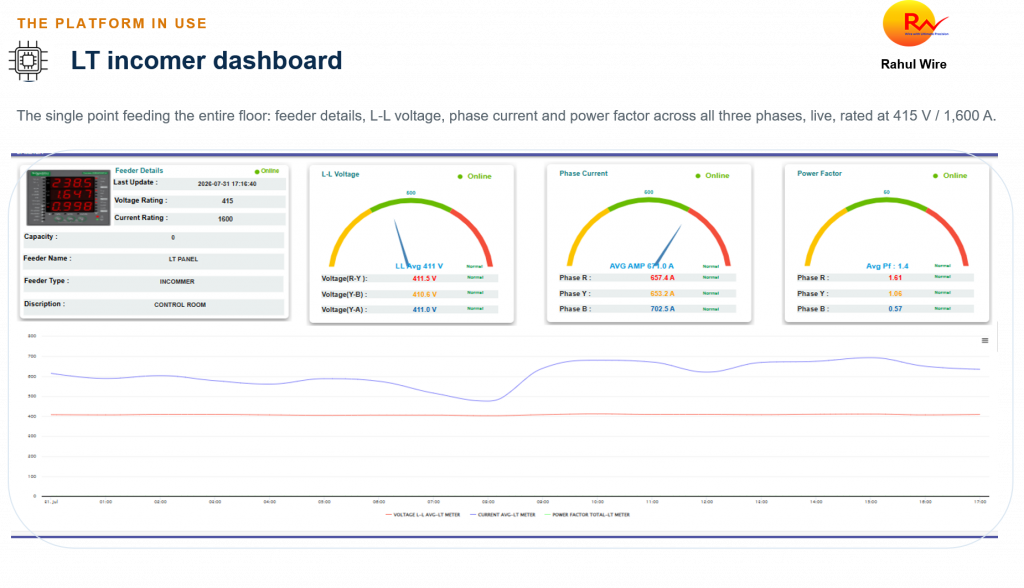
- 100% Machine and Circuit Level Visibility: Continuous 24/7 tracking across all 14 bunching machines and incoming utility feeds eliminated unwanted energy wastage and peak demand penalties.
- 1,641 Anomaly Events Caught: Power spikes, phase drifts, and voltage dips were flagged automatically in a single monitoring window.
- No More Monthly Unexpected Utility Bills: Live demand tracking prevented peak penalty surcharges before invoices arrived.
- 100% Downtime Attribution: Every stoppage was attributed to a verified operational reason.
- 24/7 Remote Control & Plant-Wide Visibility: Plant managers gained cloud access to monitor energy draw and trigger remote control actions from anywhere.
- 164,700+ kWh Tracked Live: Full transparency into plant-wide energy flow provided exact cost-per-machine figures.
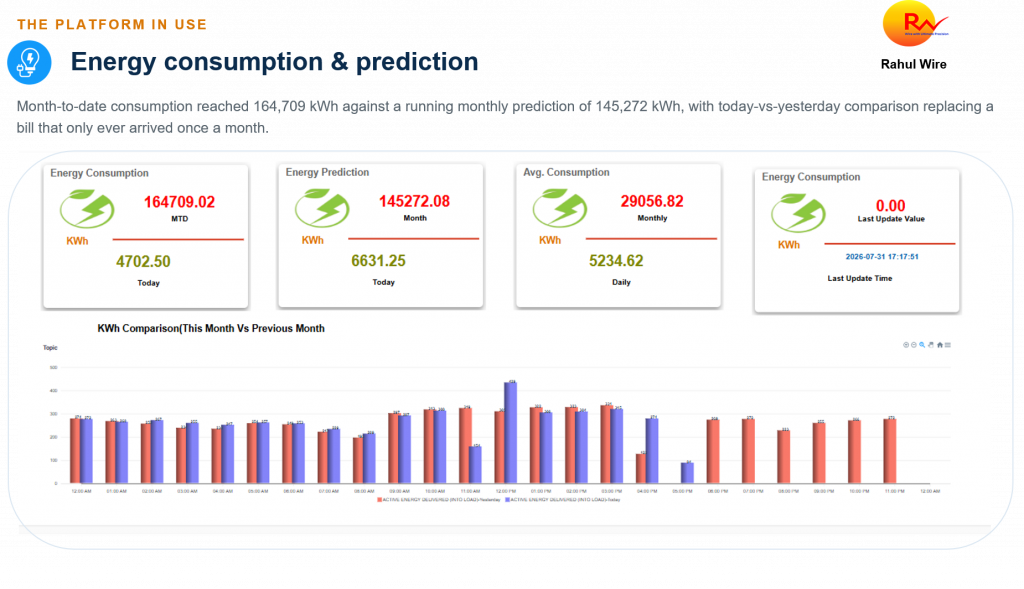
Rahul Wire Case Study
Download the official proof and system architecture presentation (PPTX).
Why Enterprises Trust IOTMATRIX for Industrial Energy Monitoring Systems
IOTMATRIX is a leading IoT Solutions provider of a cloud-based industrial energy monitoring system that empowers manufacturing facilities to track and optimise power consumption in real time. Upgrading from legacy utility meters to IOTMATRIX turns passive electrical infrastructure into an active, data-driven utility asset. Built for seamless plug-and-play deployment without operational disruption, it integrates multi-panel monitoring, automated reporting, and predictive load analytics into a single centralised view.
Key Features & Capabilities of IOTMATRIX’s Energy Monitoring System
- Centralized Multi-Plant Dashboard: Delivers shift-wise reporting and cross-facility benchmarking to streamline energy compliance and cost management.
- Plug-and-Play Integration: Seamlessly connects LT incomers, transformers, sub-panels, and heavy machinery without operational downtime. Granular Machine-Level Analytics: Tracks voltage, current, and power factor at the circuit level to pinpoint energy leakages and phantom loads.
- Automated Real-Time Alerts: Sends instant notifications for peak demand spikes and equipment degradation before costly utility penalties occur.