Manufacturing companies’ operational costs depend entirely on the electricity consumption of machines and other operational assets. In factory expenses, electricity costs continue to be one of the biggest plant operating expenses for manufacturing facilities. While many businesses, whether it is a small plant or a big manufacturing hub, only they focus on reducing overall energy consumption. But one of the important and highly expensive costs that businesses often overlook is industrial peak demand charges. These charges are based on the highest amount of power consumption in machines and facilities that draw from the grid during a specific period of time, and even a short spike in demand and power leaks can lead to significantly higher electricity bills. Tracking this power consumption and peak demand with a smart IoT-based energy monitoring system allows you to tackle these issues, save energy costs, and keep operations running smoothly without unnecessary complexity.
As we know, in a factory, many manufacturing machines and facilities are running across the plant at the same time. Energy spikes do not happen suddenly; there are many common causes of increased electricity consumption and peak demand penalties. These are the main reasons behind the high demand spike: starting multiple machines at the same time, operating energy-intensive equipment during peak production hours, and having limited visibility into real-time power consumption. Without accurate monitoring of the factory’s assets, these demand spikes often go unnoticed and make a big impact on utility bills.

Why Energy Monitoring Should Be a Strategic Priority for a Plant
Utility costs are rapidly increasing, and managing plant power consumption is no longer just a small task for the maintenance crew and ongoing operations; it is a critical business strategy for decreasing operational costs, and it directly protects your profit margins. When you don’t look at the factory floor, hidden energy waste, electricity leaks, and unmanaged machine startups silently drain your budget. If you can not see exactly where, how, & when your electricity is going, and what equipment draws power, you can not control your operational cost, which leads to increased production expenses. Shifting manual audits to an active automatic energy management system allows you to take control of electricity usage, keep production running smoothly, reduce energy costs, and stop wasting capital on unnecessary utility penalties.
That’s why an IoT-based energy monitoring system can make a measurable difference in energy cost savings. By tracking energy usage in real-time, business owners can identify when and where demand peaks occur, make it easy in power monitor on a machine level, in departments, and across the entire facilities. It helps to take decisive action before demand thresholds are exceeded. When power consumption abnormalities occur, it automatically sends alerts and notifications that help to prevent energy wastage. It enables load scheduling and demand control, which helps businesses to reduce unnecessary energy costs without affecting production performance.
In this guide, we help you to know what industrial peak demand charges are, how they are calculated, why they increase the electricity bills, and also break down exactly how to reduce peak demand charges more effectively through an IoT-based energy monitoring system. We will also explore proven practical strategies for peak load management, the role of the energy monitoring system, and the benefits of real-time energy visibility for improving operational efficiency and reducing energy costs.
Whether you operate a small production facility or a large manufacturing plant, understanding and controlling peak demand is an important step toward better energy management, lower utility expenses, and more efficient factory operations.
The Invisible Drain: The Real Cost of Industrial Energy Blind Spots
According to the NITI Aayog India Climate & Energy Dashboard, the industrial sector drives 40.4% of India’s total electricity consumption, creating a massive ₹1.6 lakh crore operational market where billions are wasted on peak demand penalties. Despite these heavy stakes, traditional factories blindly waste nearly 40% of their energy spend due to aggregate facility metering that fails to log individual machine idle states, faulty circuits, machine-level real-time energy consumption monitoring, sudden startup power spikes, and operational blind spots. Deploying an IoT-based energy monitoring system eliminates these blind spots by capturing real-time asset telemetry, power tracking, and consumption monitoring, which automatically flags unseen operational leaks and allows automation to cut peak demand charges by a staggering 51.5%.
Understanding Utility Tariff Structures and Maximum Demand Penalties
When a manufacturing company uses grid electricity to run their factory’s operation, the grid company charges electricity costs that are completely different from those of domestic, agricultural, and commercial offices. Industrial electricity bills are infamously difficult to decipher, often reading more like advanced accounting ledgers than simple utility statements. Most industrial operators look straight at the final amount due, missing the hidden regulatory traps built into corporate power tariffs. To take control of your expenses, you need to understand that utilities do not just charge you for the total volume of energy you consume; they penalize you heavily based on how fast and how inefficiently you draw that energy from the grid.
How Utilities Calculate Rolling Integration Intervals
The power grid company doesn’t look at the factory’s energy usage as a smooth, steady line over the month due to power consumption and demand fluctuations. Instead, it tracks demand in tiny, 15-to-30-minute rolling snapshot windows.
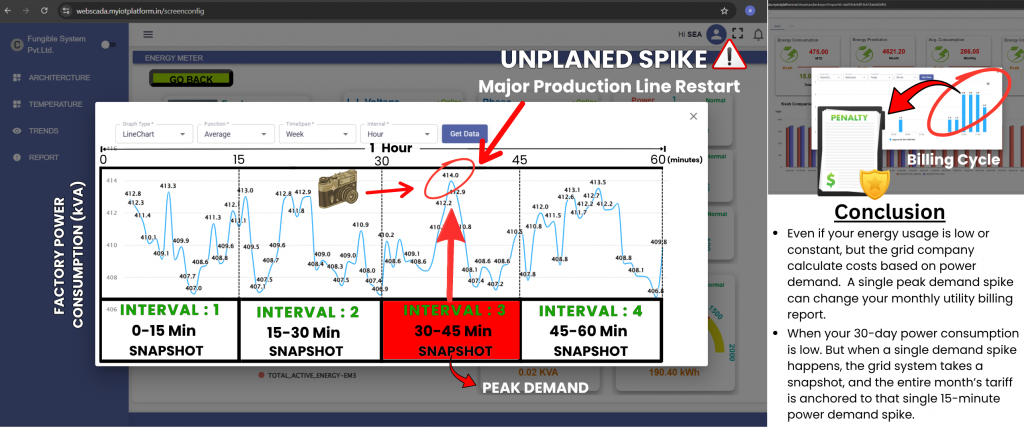
Think of this like a speed camera for electricity. If you restart a major production line and cause a massive power surge that lasts for just one of these brief windows, that single peak is locked in as your Maximum Demand for the entire billing cycle. Even if your plant runs perfectly for the remaining 29 days, your entire month’s tariff is anchored to that lone 15-minute operational spike.
The Critical Math: Active Power vs. Reactive Power (kW vs. kVAr)
A single spike can change the entire energy consumption bill. To stop these unplanned spikes, you have to understand the two forces inside the electrical lines and demand. A manufacturing plant has two powers:
- Active Power (kW): This is the actual working energy that turns your conveyor belts and runs production. It takes energy to continue the production process.
- Reactive Power (kVAr): This is the non-working energy required to build magnetic fields inside heavy equipment like AC motors and transformers. It is used in idle machinery.
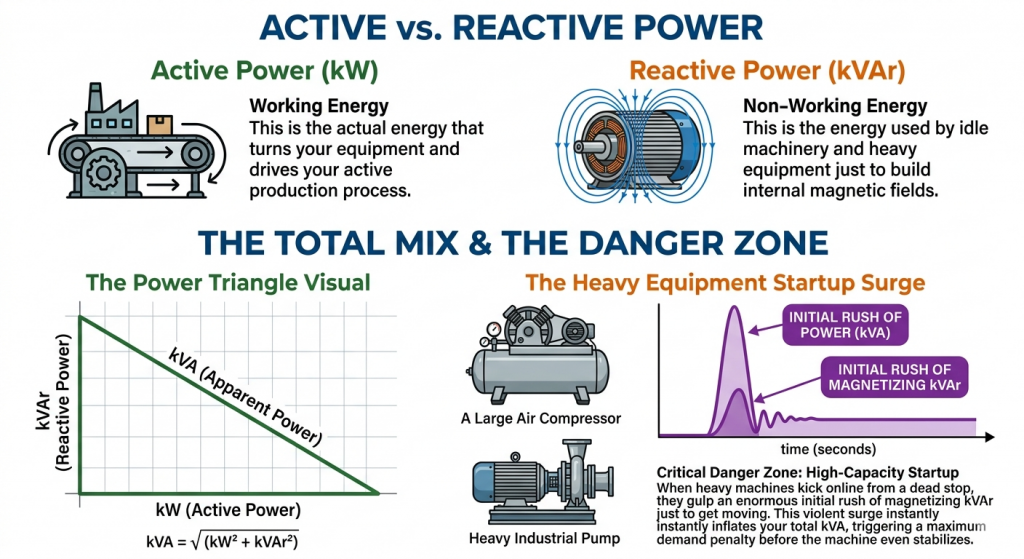
When you mix them together, you get your total Apparent Power (kVA). The real danger zone happens during high-capacity startup currents. When a massive machine like a heavy-duty industrial pump or a large compressor kicks online from a dead stop, it gulps an enormous initial rush of magnetizing reactive power just to get moving. This sudden, violent surge instantly inflates your total kVA, triggering a massive demand spike before the machine even stabilizes.
The Impact of Low Power Factor Deviations
It brings us to Power Factor (PF), which is simply the efficiency score of how well your factory converts incoming power into useful work. It is measured on a scale up to 1.0, where 1.0 means perfect efficiency.
When your shop floor is packed with unmonitored motors running sub-optimally or idling, your reactive power climbs, causing your power factor score to drop. This drop hits your wallet twice. First, a low power factor forces your overall kVA demand to swell, pushing you straight over your allowed maximum demand limit. Second, state electricity boards in India enforce strict low power factor penalties. If your efficiency dips below a set threshold (usually 0.90 or 0.95), the utility tacks an extra percentage-based surcharge onto your entire bill. Without real-time tracking, you are essentially leaving your checkbook open for the utility company to fill in the blanks.
Critical Danger Zone: High-Capacity Startup
When heavy machines are inactive from a dead stop, they gulp an enormous initial rush of magnetising kVAr just to get moving or start running after downtime. This violent surge instantly inflates your total kVA, triggering a maximum penalty before the machine even stabilizes.
What is an IoT-Based Energy Monitoring System?
Today’s digital transformation is rapidly growing in every sector, whether it is the IT sector, service sector, manufacturing, or others. That is the main reason for operational inefficiency and is hindering their business growth. Today still most of the companies rely on traditional operation management and control systems that have lack of operations visibility, tracking, monitoring and most important lack of energy consumption data, which creates a massive bill at the end of the month that business owners never know how much energy they have used, where energy exactly is going to waste and what they need to optimize that help to prevent the financial losses.
A real example: If you walk into most factories today and ask how much electricity they’re using, the plant manager will usually point to a dusty utility meter outside or pull up last month’s paper bill. But here’s the problem: that bill is ancient history. It not only shows you how much electricity consumption reading is, but it also tells you exactly how much money you have already lost. Also, it never gives you clues where electricity is highly consumed, when demand spikes happen and how to stop it from happening again.
To stop getting massive utility bills, you have to stop guessing, blindly using electricity and start looking at real-time data and tracking. That is where an IoT-based energy monitoring system plays a vital role in reducing energy wastage and tracking every machine, circuit, asset, and facility across the factory. Instead of treating your entire factory like one giant, mysterious black box, this energy monitoring software breaks your facility down into individual, trackable data points. It gives you a real view of machines’ activities, power output, and energy usage reports, so you know exactly when, where, and how they are wasting power.
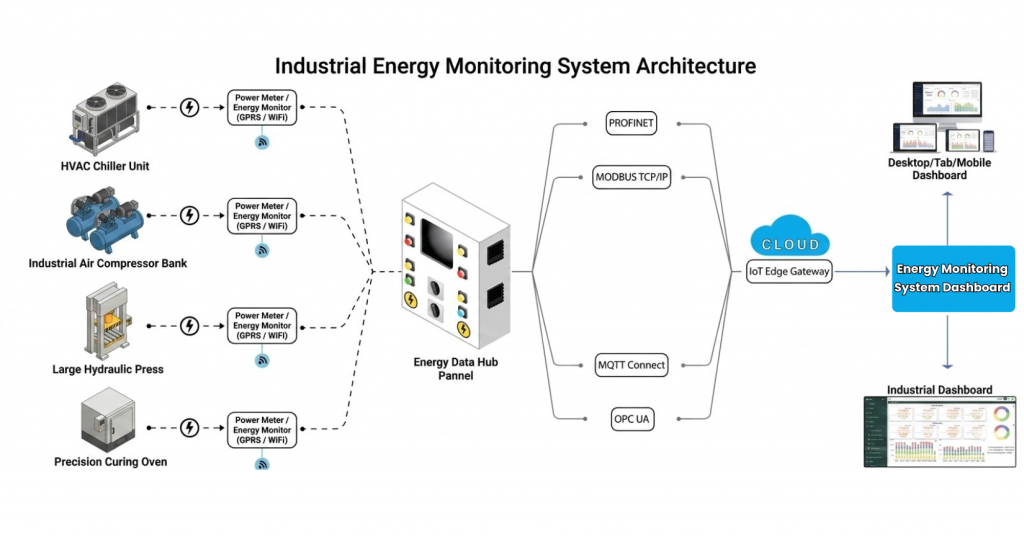
The Hardware: Smart Sensors and Edge Gateways
In a factory or plant, all the facilities and machines depend on grid power. For electrical infrastructure and manufacturing machines, stopping the power supply for any changes and finding any short circuit, it makes a full factory operations breakdown that costs lakhs of rupees in a single day. With a smart IoT-based energy monitoring system, you don’t need to rip out your existing electrical infrastructure or undergo a massive, expensive overhaul to make this work. The physical setup on the factory floor is actually remarkably simple and non-invasive.
First, clip Current Transformers (CTs) or smart sensors directly onto the main power lines of your high-capacity assets like your heavy-duty air compressors, CNC machines, manufacturing machines, molding machines or massive chillers. These sensors act like digital stethoscopes, constantly listening to the electrical pulse of each machine without interrupting production and providing you with an end-to-end real-time operations data report on a unified energy monitoring software dashboard.
These sensors feed data into localized, multi-channel smart sub-meters. Instead of just reading electricity consumption numbers for the whole building, these sub-meters track the specific voltage, current, and phase angles of individual equipment and power consumption.An edge gateway collects all of this raw electrical data. Think of the gateway as the translator on the factory floor. It takes all those messy electrical signals, packages them neatly using standard industrial protocols like Modbus, Power Modbus, MQTT and securely beams them up to the cloud over Wi-Fi or cellular networks.
The Software: Real-Time Telemetry and Cloud Analytics
Real-time data acquisition is completed, and once that data hits the cloud, the magic actually happens. You no longer have to wait 30 days for a utility bill to find out a machine has malfunctioned, the machine is getting high energy consumption and track energy wastage leaks.
The smart energy monitoring software takes that raw data and turns it into a live, easy-to-read visual dashboard that you can access from your phone or laptop anywhere in the world. You get real-time telemetry, which is just a fancy way of saying you can see exactly how many kilowatts any specific machine is drawing right this second. But the real lifesaver for your budget is instant threshold alerts. You can set up the program energy monitoring system software as per your factory’s strict maximum demand limits. If a couple of heavy machines are running simultaneously and your power draw starts creeping dangerously close to a peak penalty threshold, the system doesn’t wait for a breach. It immediately fires off an automated alert to your maintenance team’s phones or communicates directly with your floor controllers so that you can stagger the loads, cut the power spike, and save your budget before that costly 15-minute utility window closes.
How IoT-Based Energy Monitoring System Eliminates Peak Demand Penalties
When you know your assets spike the power demand suddenly, this problem is not in your hands; but also, if you think of stopping it in the middle of a busy shift or in ongoing manufacturing operations, it is a completely different story. You cannot expect a supervisor to stand in front of a power meter all day with a stopwatch, waiting to flip switches when usage gets tight manually, and power demands are very high as usual. To permanently stop maximum demand penalties, you need to shift from reacting to your power usage to organizing it. Here is the exact, step-by-step roadmap of how an IoT-based energy monitoring system moves your factory from manual guesswork to automated control and tracking.
Step 1: Establishing a Machine-Level Baseline
Before taking steps towards controlling your power draw, you need to know exactly which machine is pulling the most power on your shop floor. Without knowing it, you cannot manage what you do not measure.
The first step is mapping out the unique power draw of your individual high-capacity assets. Think of this as creating an asset-level energy bill for every heavy hitter in your facility, massive air compressors, heavy-duty CNC setups, manufacturing machines, chillers, and hydraulic pumps.
By tracking these machines over a few days, the IoT system builds predictive consumption curves. It learns exactly how much power a specific compressor gulps when it starts up versus when it is idling, and how long that initial surge lasts. Once you map these individual baselines, you stop looking at your factory as one giant, unpredictable power user and start seeing it as a predictable setup of separate machines.
Step 2: Configuring Predictive Threshold Alerts
In a factory, the machine power consumption is not always the same for all the operations. Once the system understands your floor’s normal habits, you can set your safety limits or threshold alerts. That is where you set up automated rules based on your facility’s strict contract demand limits.
The software does not just sit around waiting for you to cross the line. Instead of waiting for final data acquisition, it constantly calculates a running total of your power draw against that 15-minute utility snapshot window. If a shift change occurs and multiple heavy machines start drawing power at the exact same time, the system recognises the pattern instantly. Long before a breach actually happens, it flags the dangerous path your usage is taking and sends an alert to your engineering team. It gives your crew an early warning to fix the issue before the utility company catches you.
Step 3: Implementing Automated Load Staggering
When an automated system works for operational control and management, it is very helpful when demand spikes and abnormal consumption occurs; the system sends an important alert and takes instant energy-saving steps automatically. But real benefit happens when you let the technology handle the heavy lifting for you through smart controls. That is where it saves you time, money and improves the overall factory’s operational efficiency.
Getting an alert is helpful, but the real benefit happens when you let the technology handle the heavy lifting for you through smart controls. That is where the system saves your time and money.Instead of relying on human intervention, the system can talk directly to your machine panels or relays to execute automated load-shedding and precise machine sequencing.
For example, if the system sees that your facility is creeping dangerously close to its maximum demand ceiling, it can delay the startup of a non-critical machine like a backup ventilation fan or a secondary pump for just a few minutes. It can also enforce a strict startup order, ensuring that Compressor B does not kick online until Compressor A has finished its high-current startup phase and dropped back down to a normal level. By spreading out these power spikes, you keep your operations running smoothly while keeping your total demand safely under the penalty zone.
Step 4: Real-Time Harmonic Distortion Tracking
In manufacturing machines, when any mechanical or electrical issues occur, it does not sound normal like idle machine noise, it creates excessive electrical noise, or harmonics, from variable speed drives and heavy inverters force your transformers to run hot and waste power. The IoT energy monitoring system constantly monitors these waveform distortions directly at the distribution panel. By alerting your team to harmonic spikes before they degrade your hardware, you can install targeted filters to clean up the power supply. It keeps your equipment running efficiently and stops the utility from billing you for wasted, distorted energy.
Step 5: Automated Idle-State Power Cutoffs
Machinery in factories is not running in the same condition; it operates at a constant pace; it often alternates between active production and running idle. Machinery left idling between production batches is a massive, silent drain on your monthly billing budget. The system tracks these non-productive periods and automatically triggers relays to cut or lower power to stagnant equipment after a set timeframe. It prevents heavy motors and cooling systems from unnecessarily adding to your total load during peak production hours. It removes human forgetfulness from the equation, ensuring you only pay for power that actually drives production.
Maximizing ROI: Additional Business Benefits of Smart Energy Visibility
When companies see the highest amount of operational costs going to utility costs at the end of the month, they think about how to control the costs. They try to stop any facility or machine usage and take steps to limit the running operations. But it is not a major reason to control the costs; it’s totally guesswork and manual steps.Stopping peak demand penalties is the fastest way to see a return on your investment, but it is definitely not the only way this system saves you money. If you are looking at the overall budget, this tool changes how you manage your entire operation. It turns energy tracking from a monthly utility expense into a real tool for factory floor visibility. Here is how it helps your bottom line across the rest of your facility.
Predictive Maintenance Monitoring
When you track power quality and consumption of machines or circuit-wise in real time, you get an early warning system for your machinery. Before a critical motor burns out and halts production, its electrical behavior changes. The system flags issues like voltage unbalance and harmonic distortion long before the hardware fails. By catching these invisible electrical problems early, your team can schedule quick repairs during normal downtime instead of dealing with an expensive emergency breakdown in the middle of a rush order. It keeps your machines running longer and supports industrial asset optimization.
Granular Cost Allocation
Today, in the Indian industry, most factories take their monthly power bill and simply divide it equally across all departments. It is just guesswork. With smart tracking, you can attribute exact electrical costs directly to individual production batches, specific machine lines, or different shifts. If one specific product line uses twice as much energy as another, you will see it instantly. This accurate data helps you price your products properly, see which jobs are truly profitable, and find exactly where operational waste is happening on the floor.
Corporate ESG Compliance
As sustainability is no longer just a buzzword in industry, customers, investors, and government boards are actively demanding proof of lower emissions. Instead of paying outside consultants to audit your facility every year manually, the energy monitoring software does the work for you. It automatically converts your real-time electricity usage data into clear carbon footprint and sustainability metrics. You can download these reports whenever you need them to satisfy stakeholder requirements, prove your environmental compliance, and show exactly how much energy your efficiency upgrades are saving annually.
5 Proven Ways to Reduce Factory Energy Costs
In a factory, energy consumption costs do not depend on a single asset or facility; there are many assets and facilities running. Before making plans, multiple things we need to make sure of and take strategic steps. While you plan your transition to automation, there are immediate, hands-on steps your engineering team can take right now to stop the financial bleeding on the factory floor.
1. Stagger Machine Startups Manually With 10- Minute Delay:
Until you automate your operations and machines, you need to create a strict schedule calendar on paper for shift changes. You can take smart steps to prevent peak demand charges and huge surges in energy consumption. Keep a 10-minute delay between turning on your heaviest machinery, like air compressors and CNC setups, so their initial power surges never overlap and reset your monthly peak demand charge.
2. Link Auxiliary Systems to Main Lines for Optimize Electricity Usage:
Walk the floor and check your auxiliary gear, like dust collectors and ventilation fans. Ensure they are wired to turn off or drop into low-power modes whenever the primary production line sits idle for more than 5 minutes.
3. Run a Weekend Air Leak Audit and Check End-to-End Line:
Air compressors are massive energy gluttons, and line leaks can easily waste 30% of your generated air. Have your maintenance crew check the pipe networks during a quiet weekend shift using soapy water or an ultrasonic detector to fix pressure drops immediately.
4. Raise Chiller Setpoints by Just 1°C to Prevent High Power Consumption:
Check your process cooling requirements. If your operators are running chillers colder than necessary, raising the target temperature by just 1°C can lower that specific cooling unit’s power consumption by up to 3% without hurting production quality.
5. Check Your Local Capacitor Banks:
Make sure your localized capacitor banks are installed directly next to your largest inductive motors, not just at the main panel. It cleans up your power factor efficiency right at the source, helping you avoid low power factor penalties before you even install live tracking.
Why Choosing the Right Energy Monitoring Partner Controls Your Long-Term Savings
Buying an energy monitoring system is not just about purchasing hardware off a shelf. Any basic meter can show you that your factory is using electricity. The real financial return depends entirely on what happens to that data next. If you choose a provider that just hands you a complicated software dashboard full of raw charts, your team will eventually stop looking at it, and your utility bills will stay the same.
To improve efficiency, reduce energy costs and achieve long-lasting operational savings, you need a partner that is a reliable and efficiency-focused energy monitoring system provider that delivers automated control at the machine level and helps to prevent peak demand penalties. Here is what separates a basic vendor from a partner that actually impacts your bottom line.
Hardware Durability Meets Scalable Edge Control
Your factory floor is a harsh environment with heat, dust, and constant electrical noise. Cheap sensors and flimsy gateways will drop signals or fail within months. You need robust, industrial-grade hardware that maintains clear data transmission even in the toughest conditions. More importantly, your provider must offer edge intelligence. True savings do not come from looking at a peak demand penalty after it has already happened. The right system actively communicates with your existing machinery to stagger startups and drop non-critical loads automatically before you breach your utility limits.
Actionable Insights Instead of Cluttered Dashboards
A busy plant manager does not have two hours a day to analyze raw data tables. The right provider builds software that cuts through the noise. Instead of just showing you lines on a graph, the system should tell you exactly which air compressor is lagging, which production line is wasting power during idle states, and precisely how close you are to a maximum demand penalty. Look for a partner that prioritizes clear, practical visibility over dense, confusing metrics.
How IOTMATRIX is Shaping the Industry for Energy Saving and Reducing Utility Costs
In a large-scale manufacturing plant, managing volatile industrial energy tariffs and peak demand penalties requires moving beyond traditional sub-metering. You need smart energy management software that gives you end-to-end energy consumption visibility in real time, covering every machine, circuit, facility, department, and the entire factory floor.
IOTMATRIX is India’s leading industrial IoT and smart factory solution provider. Our enterprise-grade energy monitoring system transforms your raw data into measurable savings. Built on an advanced, AI-enabled architecture, the system utilizes predictive machine-learning models to analyze your facility’s consumption baselines in real time.
By tracking your previous power data, the AI prediction algorithm accurately forecasts how much energy your facility will consume on an hourly, daily, weekly, or monthly basis. This foresight allows you to prevent peak demand penalties, reduce waste, and take strategic steps to save on energy costs before they impact your utility bills.
The platform continuously maps power draws against strict 15-minute utility snapshot windows, identifying hidden power anomalies, load imbalances, and harmonic distortions before they manifest as expensive line items on your monthly invoice. By combining intelligent edge data gateways with automated load-staggering sequencing. IOTMATRIX smart IoT electricity consumption meter eliminates manual guesswork on the shop floor, safeguarding your business growth by lowering operational expenses.

Don’t let unpredictable peak demand spikes dictate your facility’s profitability. Contact our engineering team today to schedule a live demo of the IOTMATRIX energy monitoring platform and discover how a customized, AI-driven energy deployment can secure your operations, eliminate utility penalties, and maximize your bottom-line efficiency.