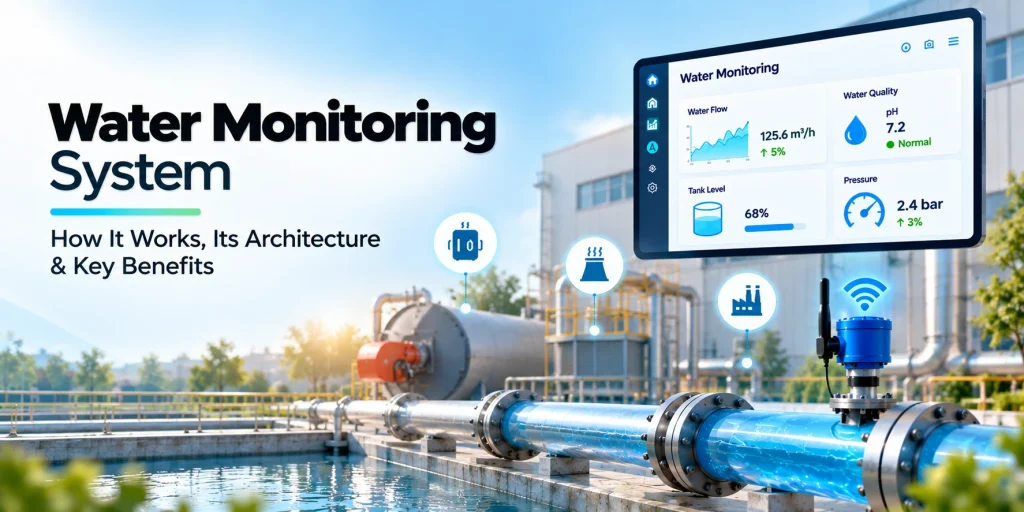
By the time you see a water problem, undetected leaks and inefficiencies have usually been adding hidden costs to your monthly utility bill.
Most water problems do not announce themselves. A tank overflows slowly overnight, a pipe leaks underground for weeks, or the pH of treated water drifts a little more each day. Without regular audits and real-time visibility and control over your water supply, you are operating blind. Small issues go unnoticed until they turn into operational shutdowns or full-scale water disasters.
A water monitoring system is a setup of sensors, a controller, IoT connectivity and software that keeps a 24×7 watch on your water. It measures both quality and quantity, shows real-time readings on a dashboard, and alerts you the moment something looks wrong.
In this guide, we answer what is a water monitoring system, then walk through how it works, its key components, architecture, protocols, benefits and real-world applications, and finish with a practical roadmap for implementing one.
What Is a Water Monitoring System?
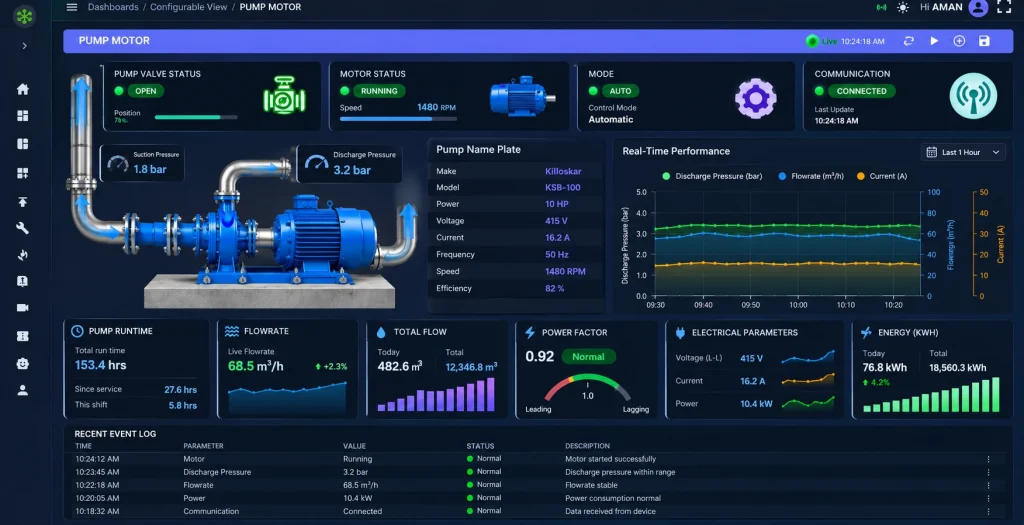
A water monitoring system is a setup of sensors, a PLC, an IoT, and software that watches your water around the clock. It measures quality and quantity, shows the readings on a dashboard, and alerts you the moment something looks wrong.
Think of a home water tank. A level sensor shows how full it is, and a pump switches on or off automatically. A water monitoring system goes further and also checks what is in the water such as pH, turbidity, TDS, chlorine and temperature, along with flow rate and pressure.
Sensors measure the water, a gateway sends the data over Wi-Fi, 4G, LoRaWAN or NB-IoT to the cloud, and you see live readings on an app. If a value crosses your limit, you get an alert within seconds, and the system can even switch a pump off on its own.
AI-powered water monitoring systems make it smarter by understanding what normal looks like for your site, so it can catch slow leaks or gradual quality changes, predict faults early and reduce false alarms.
Unlike manual testing, which gives only a snapshot, it gives you the full picture continuously, so problems are caught as they begin.
Components of a Water Monitoring System
A water monitoring system is built from several parts that work together, tracking a reading from the water to the phone in your hand.
Water Quality Sensors
Track key water parameters, including pH, turbidity, TDS, conductivity, dissolved oxygen, ORP, chlorine and temperature. Choose from several sensors that match your use case and water type, since a probe that works in tap water can fail quickly in sewage.
Level, Flow and Pressure Sensors
Show how much water there is and how it moves, using ultrasonic, radar, float or pressure sensors and flow meters. They support leak detection, overflow prevention and consumption tracking.
Edge Controller (IoT Gateway, RTU or PLC)
Reads sensor signals, applies calibration to correct sensor drift and errors, adds timestamps and runs basic checks on site. It also stores data during network failures and uploads it later, so records have no gaps.
Communication Network and Protocols
Sensors connect to the controller via 4-20 mA, Modbus RS-485 or SDI-12. The controller sends data to the cloud via Wi-Fi, 4G, 5G, NB-IoT, LoRaWAN or Ethernet, usually using MQTT. Use LoRaWAN or NB-IoT for low-power sites and 4G when you need more bandwidth.
Power Supply and Backup
Most sites run on mains power. Remote locations such as rivers, canals and borewells use solar panels with battery backup, sized to keep the system running even when the weather is bad for 2 to 3 days (or more).
Cloud Platform and AI Analytics
Stores time-series data and checks it against your limits. AI learns what normal looks like for your site, catching slow leaks and gradual quality drift. Open APIs connect it to SCADA, GIS or billing systems.
Dashboard and Mobile App
Shows real-time readings, trends, maps, reports, and sends SMS, email or app alerts when a value goes out of range.
Situation-Based Automation
Relays, valves and chemical dosing systems let the system respond automatically to what is happening in the water, such as switching off a pump at high level or closing an intake valve when turbidity rises.
Find out where your site is losing water and energy with an AI-powered water monitoring system.
Book a Free DemoFrom Manual Meter Readings to IoT Water Monitoring
Traditional water tracking means reading mechanical meters once a day or once a month and typing figures into a register or spreadsheet. IoT water monitoring replaces that with readings every few seconds or minutes, sent automatically measurement. The shift is from looking back at what happened to seeing what is happening right now, and with AI, predicting what is likely to happen next.
Why Does Manual Water Metering Fail?
Traditional water metering only gives you delayed, occasional and sometimes inaccurate readings. By the time you spot a problem, the loss has already happened. Here are seven reasons this method falls short:
1. Hidden Water Leaks and Untracked Water Usage Go Unnoticed
Leaks never fix themselves. A cracked underground line or a constantly overflowing tank can waste thousands of litres day and night. Monthly reports show only a big number at month-end, not where the loss is happening. And with no meters on many branches, much of the consumption is never measured at all.
2. Data Gaps and Errors in Manual Water Logs
Common errors in manual water registers include:
• Missed rounds
• Misread dials
• Transposed digits
• Estimated or copied entries
A single wrong reading may go unnoticed. Over months, these errors build up and make your records unusable for audits, budgeting or spotting trends.
3. Cost, Energy and Compliance Impact
Every litre you lose has already been pumped, treated and often stored, so a leak drains your electricity bill as well as your water supply. Overfilled tanks and pumps left running push energy costs even higher.For industries and treatment plants, the stakes are bigger still.
4. Hard-to-Reach Meters Make Regular Readings Difficult
Water meters tend to sit in the least convenient places, such as underground pits, basements, rooftop tanks, borewell chambers and locked utility rooms. Reaching them can be slow, unsafe or, during monsoon flooding, simply impossible. As a result, readings get skipped, delayed or guessed, and large or multi-site facilities need extra staff just to finish one round.
5. Mechanical Wear Quietly Reduces Meter Accuracy
Mechanical meters rely on gears, impellers and dials that wear out with use. Sediment, scaling, corrosion and air pockets make them under-read, stick or stop altogether. Because the decline is gradual, a failing meter keeps recording less water than actually flows, and nobody notices until it is calibrated or replaced.
6. Foggy, Dirty or Damaged Dials Lead to Misreadings
Condensation, dirt and cracked glass can make a dial impossible to read. Add poor lighting in pits and basements, and even a perfectly working meter produces wrong numbers.
7.Manual Logs Cannot Raise Alarms, So Problems Are Caught Late
A clipboard cannot send an alert. Even when a worker spots something unusual, the information crawls through logs and reports before anyone acts. By then, a small leak has already become a big loss.
How Does a Water Monitoring System Work? From Sensor to Cloud
A water monitoring system works by turning a physical property of water, such as its acidity or level, into a digital reading, moving that reading to the cloud, and then showing it to you with alerts when something goes wrong. The whole journey usually takes a few seconds.
Step 1: Sensors Measure the Water
Sensors are installed in tanks, borewells, pipelines, open channels or treatment plants, and they convert water properties into electrical signals. A pH probe outputs a signal based on acidity, a turbidity sensor measures cloudiness in NTU, and a pressure sensor indicates the water level in a tank.
Step 2: The Edge Controller Collects and Process the Data
The raw signal travels to an on-site controller, which may be an IoT board, a data logger, an RTU or a PLC. Sensors connect to it through 4-20 mA analog signals, Modbus RS-485 or SDI-12. The controller converts the signal into a real value such as pH 7.2, applies calibration, removes electrical noise, averages readings and adds a timestamp. It can also run local checks, so a critical reading is flagged even if the internet is down.
Step 3: The Network Sends Data to the Cloud
The controller sends data over Wi-Fi, 4G, NB-IoT, LoRaWAN or Ethernet, depending on distance, power and data volume. LoRaWAN and NB-IoT suit remote, low-power sites, while 4G suits high-bandwidth needs. MQTT is the common protocol, and if the network drops, the controller stores data and uploads it later.
Step 4: The Cloud Stores and Analyses the Data
On arrival, the platform checks that the data is valid, stores it as a time-series history and compares every reading against the limits you have set. This is also where AI adds value. Models learn what normal looks like for your site, such as usual night-time flow or typical pH through the week, and flag slow leaks, gradual quality drift or early signs of sensor and pump faults that fixed thresholds would miss.
Step 5: Dashboard and Alerts Keep You Informed
Track live gauges, trend graphs, maps and reports on a web dashboard or mobile app. When a value crosses a limit, the system sends an SMS, email or app notification within seconds, so you can respond before a small issue becomes an expensive one.
Step 6: Automation Closes the Loop
In more advanced setups, the system acts on its own through relays, solenoid valves and motor starters. A low tank level starts the pump, a high level stops it, and a sudden rise in turbidity closes the intake valve.
What Are the Core Capabilities of a Water Monitoring System?
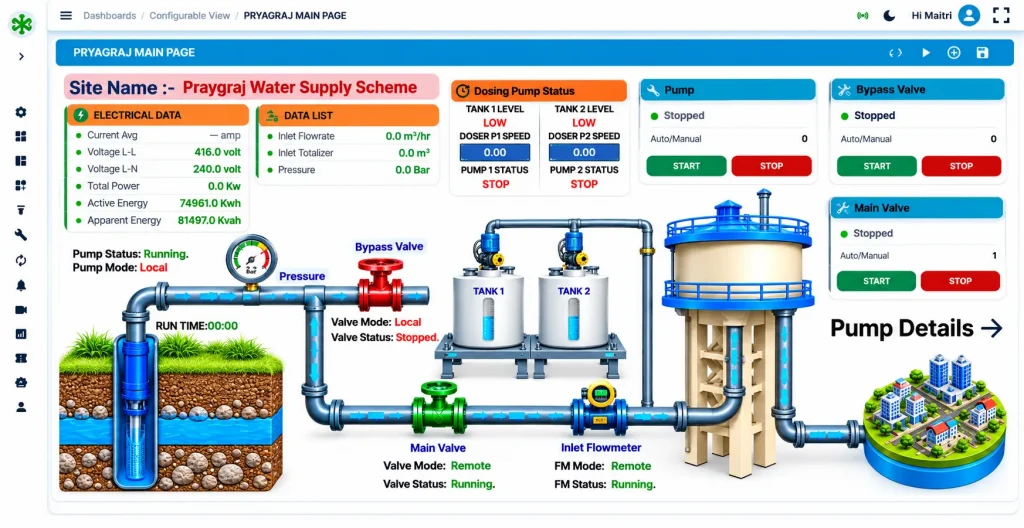
A water monitoring system has five core capabilities:
Water Flow and Consumption Monitoring:
Flow rate (m³/h or LPM) and totalised volume show how much water each building, process line or department uses. This is the foundation for water balance, leak detection and cost allocation.
Tank and Sump Level Monitoring:
Level readings in overhead tanks, underground sumps and raw-water reservoirs tell you how much water is available. They also tell you when to start pumping and when to stop before an overflow.
Pipeline Pressure Monitoring:
Pressure in the bar tracks the health of your distribution network. A sudden drop can mean a burst. Low pressure at the far end of a line can mean a blockage or an undersized pump.
Water Quality Monitoring:
Common quality parameters include pH, TDS, conductivity, turbidity, residual chlorine and dissolved oxygen. These matter most for drinking water, RO plants and treated effluent discharge.
Pump Run Hours and Valve Status:
Run hours, start/stop counts, motor current and valve open/close status show how hard your equipment is working and when it needs maintenance. AI models use these trends for predictive maintenance, flagging a pump whose current draw or run time is drifting before it fails.
Key Parameters
- Physical: Temperature, turbidity, total suspended solids (TSS), total dissolved solids (TDS) and electrical conductivity (EC), water level, and flow rate.
- Chemical: pH, dissolved oxygen (DO), biochemical oxygen demand (BOD), chemical oxygen demand (COD), residual chlorine, nitrates, ammonia, heavy metals, and fluoride.
- Biological: Total coliform, E. coli, disease-causing pathogens, and algae.
- Emerging contaminants: PFAS, microplastics, and pharmaceutical residues.
- Radiological (where applicable): Radon, uranium, and gross alpha/beta radioactivity.
What Is the Architecture of a Water Monitoring System?
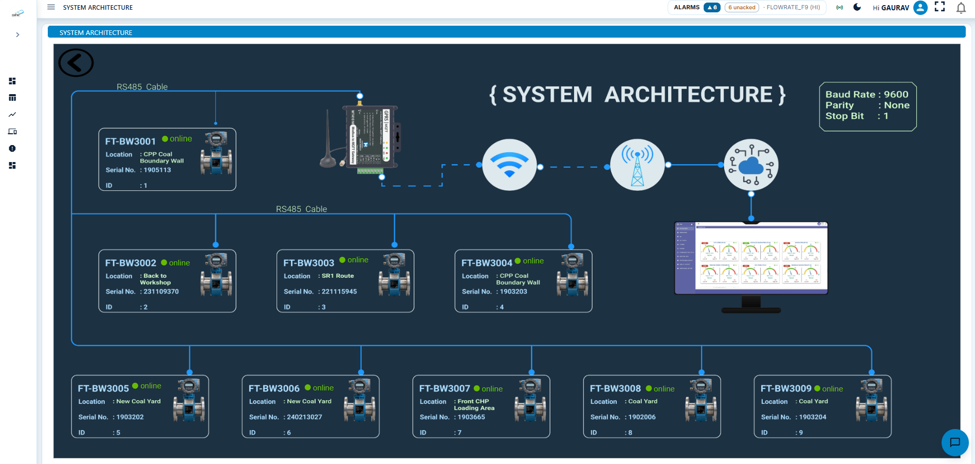
The architecture of a water monitoring system is the way its hardware, network and software are organised into layers, so that a reading taken in the water reaches a decision-maker reliably and securely.
Layer 1: Perception Layer
This is the layer that touches the water. It contains the quality sensors (pH, turbidity, TDS, dissolved oxygen, chlorine, temperature), the level, flow and pressure sensors, and any actuators such as valves and pumps. Its only job is accurate measurement. Sensor placement, wetted material, range and calibration matter most here, because bad data at this stage cannot be repaired by software later. A turbidity probe fitted in a dead zone or an air pocket will give confident but totally inaccurate readings.
Layer 2: Edge Layer
The edge layer is the on-site controller, which may be an IoT gateway, RTU or PLC. It reads the sensor signals through 4-20 mA, Modbus RS-485 or SDI-12, applies calibration, filters noise, adds timestamps and checks basic limits locally. It can also run simple control logic, such as stopping a pump at a high level, without waiting for the cloud. A well-designed edge device uses store-and-forward memory, so readings are kept during a network outage and uploaded when the connection returns. This is what separates a dependable system from a fragile one.
Layer 3: Network Layer
This layer carries data from the site to the cloud. It combines the physical connection, such as Wi-Fi, 4G/LTE, NB-IoT, LoRaWAN or Ethernet, with the messaging protocol on top, usually MQTT, or HTTPS and OPC UA for integration with industrial systems. Choices here decide battery life, running cost and coverage. LoRaWAN and NB-IoT suit low-power sites with small data, while 4G suits higher bandwidth needs. Data should always travel encrypted using TLS, with a unique credential for each device.
Layer 4: Cloud and Application Layer
The cloud ingests the data, validates it and stores it as a time-series history. It handles device management, user roles, security, rules and alerts, and runs analytics, including AI models that learn normal patterns and detect leaks, anomalies and early equipment faults. On top of this sit the web dashboard, mobile app and reports, along with APIs that connect the platform to SCADA, GIS, ERP or billing software.
What Are the Benefits of a Water Monitoring System?
Here is how each benefit shows up in real use.
Real-Time Visibility and Control of Your Water
Real-time readings of quality, level, flow and pressure on a dashboard or mobile app mean nobody has to visit the tank, pump house or plant just to check. One person can watch many sites from a single screen.
AI Fault Prediction and Detection
AI learns what normal looks like for each pump, pipe and tank, and flags early drifts like rising motor current or gradual pH change. You fix faults before they fail, and fewer false alarms mean your team trusts every alert
Stop Water Loss Before It Spreads
Overflow prevention, leak detection and consumption tracking cut water losses directly, while condition-based valves close within seconds of a level, pressure or quality limit being crossed. Utilities reduce non-revenue water, and housing societies and campuses end the overflowing-tank problem with automatic pump control.
Easier Compliance and Reporting
Automatic, time-stamped records make audits far less stressful. In India, drinking water is commonly benchmarked against BIS IS 10500, and industries must stay within discharge norms set by pollution control authorities. A continuous log gives you proof that you stayed within limits, and instant alerts help you act before you cross them. Always check the latest standard that applies to your case.
Track Resource Use by Machine and Line
Tracking water and energy consumption monitoring by machine and line shows where resources are wasted, so you fix leaks and power-hungry equipment early and see the true cost of every unit produced. It also measures treated water reuse and keeps records ready for audits and sustainability reports.
Lower Operating Cost
Fewer manual site visits, optimised pump running hours, lower electricity use and more precise chemical dosing all reduce expenses. In treatment plants, better control of aeration alone can save a meaningful amount of energy.
Better Decisions from Data
Weeks and months of readings reveal patterns such as peak demand hours, seasonal changes and equipment ageing. This helps you plan capacity, schedule maintenance and justify investments with evidence instead of guesswork.
Public Health and Environmental Protection
Continuous turbidity and chlorine monitoring helps you detect contamination in drinking water sooner. At industries and treatment plants, it alerts your team before untreated or non-compliant water reaches rivers and groundwater.
AI Chatbot Monitoring
Instead of opening reports and exporting data, you ask questions in plain language, such as “Which tank is lowest right now?” or “Did any pump run longer than usual last night?” Managers and non-technical staff get instant answers without waiting for someone to prepare a spreadsheet. Decisions become faster, and data no longer depends on one technical person.
Predictive Maintenance and Reliability
Rising motor current, falling flow or a drifting sensor can signal a fault before it happens. Fixing these during planned maintenance avoids breakdowns, protects equipment and keeps supply steady.
Water Management System vs SCADA vs Smart Water Meter
Here are the 8 key differences:
| Basis of difference | Smart Water Meter | SCADA | Water Management System |
|---|---|---|---|
| 1. Primary purpose | Measures water consumption at one point | Monitors and controls equipment in real time | Plans, controls and optimises water use across the organisation |
| 2. Scope | Single device at a single point | Plant, pumping station or distribution network | Multiple sites, departments and the whole water cycle |
| 3. Parameters covered | Flow and totalised volume only | Flow, level, pressure, pump and valve status | Flow, level, pressure, quality, equipment, cost and usage targets |
| 4. Control capability | None, measurement only | Direct control of pumps, valves and motors | Control plus scheduling, automation rules and policies |
| 5. AI and analytics | Little or no AI; basic readings and consumption history | Mostly rule-based alarms; AI is an add-on in modern AI-enabled SCADA | AI built in: anomaly and leak detection, demand forecasting, predictive pump maintenance and natural-language insights |
| 6. Users | Billing teams, residents, facility staff | Plant operators and control-room engineers | Management, sustainability, operations and finance teams |
| 7. Reporting and compliance | Consumption bills and meter reports | Shift logs and alarm history | Audit-ready, ESG and regulatory reports, with AI-generated summaries |
| 8. Cost and complexity | Low cost, quick to install | Medium to high, needs engineering and integration | Highest, but delivers the widest savings and control |
Which Communication Protocols Does a Water Monitoring System Use?
Water monitoring uses field protocols to read sensors and IoT protocols to reach the cloud, and a platform speaks both.
Sensor Signals Using 4–20 mA, Pulse and Modbus RTU
4–20 mA is the industry standard for analog level and pressure signals because it resists electrical noise over long cables. Pulse outputs count litres from flow meters. Modbus RTU over RS-485 lets one gateway poll many digital meters and quality analysers on a single cable.
MQTT over TLS for Cloud Communication
MQTT is a lightweight real-time data messaging protocol that works well on mobile networks with limited bandwidth. Running it over TLS encrypts every message between gateway and cloud.
Modbus TCP and OPC UA for Plant Integration
Modbus TCP connects Ethernet-based PLCs and meters. OPC UA provides secure, structured data exchange with existing SCADA, DCS and MES systems in larger plants.
| Option | Best for |
|---|---|
| 4G/5G/LTE | Remote or scattered sites with no wired internet |
| Ethernet | Plants and buildings with existing LAN |
| LoRaWAN | Many low-power battery sensors spread over a large campus or township |
Why IOTMATRIX Is the Smart Choice for Multi-Site and Industrial Water Operations
Water problems stay hidden until the damage is done, and IOTMATRIX helps you see them first. We build complete water monitoring systems that cover the whole described in this guide, from the sensor in your tank to the alert on your phone, so you do not have to stitch together parts from different vendors. Our systems combine water quality, level, flow and pressure sensors, edge controllers, secure connectivity, a cloud platform and a mobile app, and we match them to your water type, site and power conditions instead of forcing one setup everywhere.
You get live dashboards and instant SMS, email or app alerts the moment a value crosses your limit. Our AI learns what normal looks like for your site, so it catches slow leaks and gradual quality drift with fewer false alarms. We support even remote sites with solar and battery-backed options, local data storage and condition-based automation, and our open APIs connect with your SCADA, GIS and billing systems.
How Can Water Monitoring Help Your Site Move from Leaks to Savings?
Water problems stay hidden until the damage is done, and a water monitoring system changes that. It replaces slow, error-prone manual readings with live data from every tank, pipe and pump. Flow meters, level sensors and pressure transmitters capture what is happening in the field, gateways send it securely to the cloud, and AI turns it into early leak alerts, demand forecasts and maintenance warnings that your team can act on immediately.
The outcome is a clear move from losses to savings: leaks caught in hours instead of months, pumps protected from dry-run and overflow, lower water and energy bills, and audit-ready reports generated without manual effort.
Whether you run a factory, a treatment plant, a commercial building or a residential campus, the path is the same. Start with a water audit, prove the savings with a pilot, then scale across every site.
Connect your existing meters and pumps for real-time alerts, AI insights and remote control on one unified dashboard.
Request a quote