
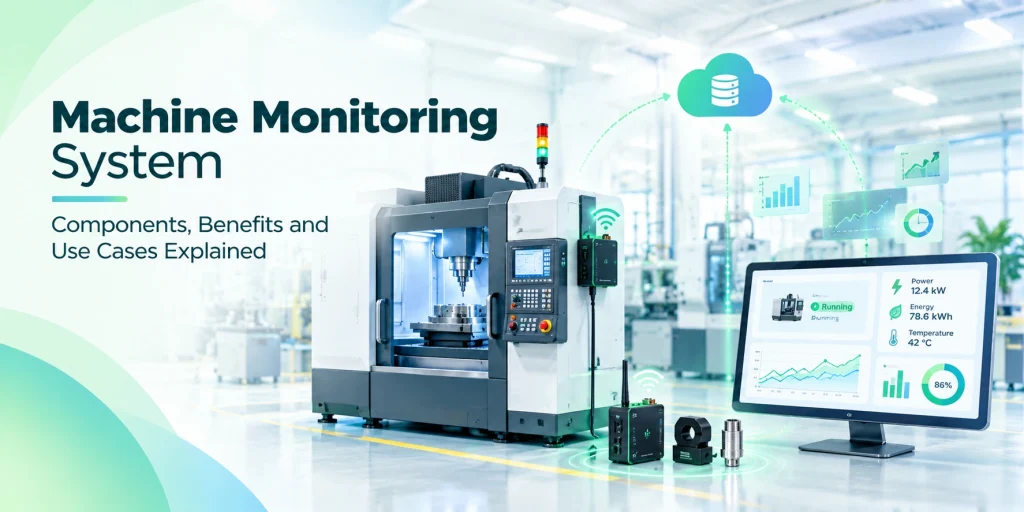
In most factories, machines run all day, but the data about them is often incomplete. Without machine monitoring, the numbers are collected from paper logbooks, a supervisor’s memory and a spreadsheet that was updated in a hurry. So it is hard to know how much each machine really produced and where the time was lost.
This gap is costly. Siemens’ 2024 True Cost of Downtime research found that unplanned downtime costs the world’s 500 biggest companies around $1.4 trillion a year, roughly 11% of their revenues. ABB’s Value of Reliability survey of 3,215 plant maintenance decision-makers shows the same problem at plant level: 69% of industrial businesses face an unplanned outage at least once a month, and the median cost is close to $125,000 per hour.
A machine monitoring system fixes this problem. It takes data directly from the machines and shows it live on a screen. It records what each machine is doing, how well it is working and when something starts to go wrong. An AI chatbot adds to this by letting users type a question in simple words, such as “Which machine had the most downtime today?”, and get an answer right away, without opening any report or applying any filter. This guide explains what a machine monitoring system is, how it works, what it measures, how it is different from MES and SCADA, how the AI chatbot helps, and why it is a smart investment for manufacturers.
What Is Machine Monitoring System?
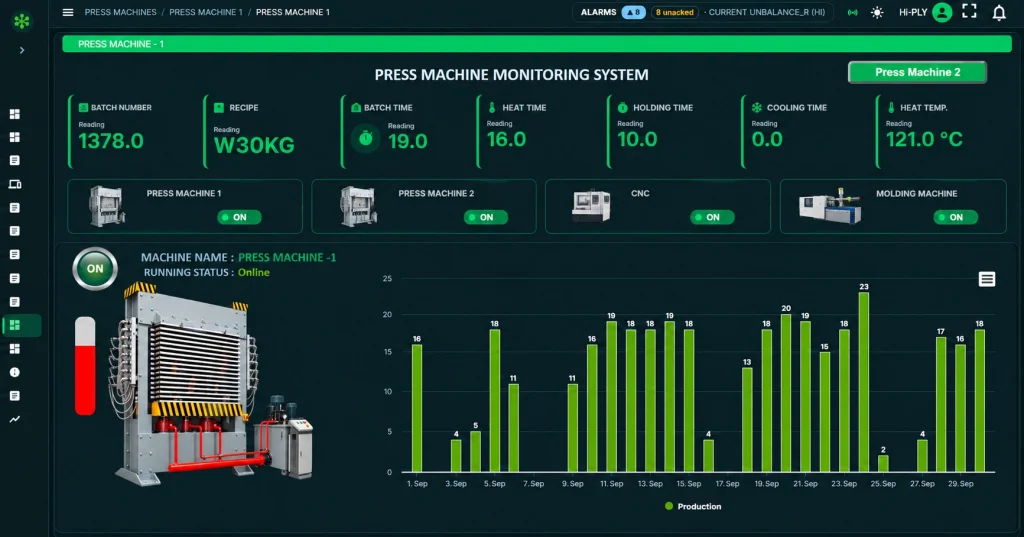
A machine monitoring system is a combination of hardware and software that automatically collects live data from industrial machines, such as running status, production count, cycle time, downtime and energy use. It shows this data on real-time dashboards, automatically computes OEE, and gives immediate alerts when something goes wrong, so teams can find losses then act quickly on reporting parts. Machine monitoring systems are used across manufacturing, food and beverage, pharmaceuticals, textiles, automotive, and metal and steel plants, essentially any industry running production equipment that can’t afford unplanned downtime.
The easiest way to picture it is as a live window into the shop floor. Instead of waiting for someone to write down what happened, the system watches the machines all the time and records every start, stop and slowdown as it happens. Sensors or controller connections capture the raw signals at the machine, an IoT gateway carries those signals across the network, and a software platform turns them into charts, alerts and reports. Anyone, from an operator to a plant head, can view them on desktop or a phone in real-time.
The system also sends immediate alerts by SMS, email or app notification when a machine stops, slows down or crosses a set limit. This means a problem is known within minutes, not hours later. When downtime is reduced, less energy is wasted and maintenance can be planned ahead, so operating costs fall.
Most modern systems are built on the Industrial Internet of Things, which is why the same idea is also called IoT machine monitoring, OEE monitoring or machine utilization tracking. In each case, the platform automatically computes OEE, so no one has to calculate it by hand. The names are different, but the purpose is the same: to replace guesswork with insightful data.
Core Components of the Machine Monitoring System
- Sensors and signal sources: Current sensors, proximity sensors, counters, stack-light readers or vibration probes are fitted at the machine to capture raw data.
- Controller connection: If a PLC or CNC controller can be read, the system connects to it directly to collect data such as part count and program status.
- Industrial IoT gateway: It collects the parameter from machines and sends them forward using protocols such as Modbus RTU/TCP, MQTT, OPC UA or HTTP/ REST API.
- Software platform and AI analytics engine: This refers to the brains of the system. It gathers machine information, creates logic from it, and computes OEE automatically whether hosted in the cloud or on premise. Built-in AI and machine learning models analyze this data continuously to detect anomalies, forecast load, and flag likely root causes rather than just raw numbers.
- Dashboards, alerts and reports: They provide real-time manufacturing and system performance monitoring, deliver the results to the people who need them, and send warnings immediately when an issue arises.
Key features:
Real-time Operation metrics: Track live data such as machine health overview, cycle time and temperature, and analyze the monitoring status of each machine in one place.
Automatic OEE calculation: Availability, performance and quality are calculated automatically, so there is no need for manual spreadsheets.
Production and cycle-time tracking: it provides real-time actual output compared with target shift by shift, and slow cycles and micro-stoppages are exposed.
Downtime capture with reason codes: Every stop is timestamped automatically, and operators tag the cause so that lost time is recorded consistently.
AI-Powered Alerts & Predictive Notifications : Sent instant notification through SMS, email or app alerts reach the right person within minutes when a machine stops or a parameter crosses a set limit. AI is used to flag early warning signs, such as a gradual drift in current or vibration, before a fixed limit is even breached, giving teams a head start rather than just a reactive alert.
Visual Multi-site dashboards: View all factories on one screen with live shop-floor activity, KPIs and operational health, so leadership can compare plants and spot problems quickly.
Predictive alerts and anomaly detection: Early warnings flag like vibration, current , heat trends to forecast abnormal behavior before it turns into a breakdown.
Support for legacy and mixed-brand machines: Retrofit sensors and standard protocols (Modbus RTU/TCP, MQTT, OPC UA) bring old and new machines onto one platform.
AI based Performance history and trend analysis: Data from machines, including modern computerized programmable logic controllers (PLCs), is stored over time, so managers can compare shifts, machines, products and plants to spot patterns over time.
Role-based dashboards: Operators, supervisors, managers and leadership each get the view they need on screens, desktops and mobile phones.
Let AI connect your legacy machines and modern machine monitoring system into one intelligent live dashboard.
Can You Monitor Old or Legacy Machines?
Retrofitting with IoT sensors:
Machines with no digital output can be fitted with external sensors. A current sensor shows on/off status, a proximity sensor counts cycles and production, and a stack-light reader interprets the red, amber and green signals. Vibration, temperature and energy consumption can also be tracked from outside. The sensors are fitted without touching the machine’s wiring, so installation is quick, production continues, and the warranty and safety systems are not affected.
Monitoring Machines Without PLC or Controller Access
Some machines have controllers that are locked by the manufacturer, too old to communicate, or missing altogether. Even then, monitoring is still possible. By reading signals from outside the machine, such as electrical current and a cycle counter, the system can work out status, utilization, production count and downtime. If the machine uses Modbus or serial communication, a protocol data converter can bring its data to the dashboard.
You may not see every internal parameter, but you still get the key measurements that drive most operational decisions.
Mixed-Brand Machines on a Single Platform
Most factories run machines from different brands, such as a Japanese CNC, a European press, a local injection molding machine and an old lathe. A protocol-agnostic IoT platform brings them all together using IIoT gateways. Newer PLC-based machines connect through Modbus, MQTT, OPC UA, MTConnect or REST API, and older ones connect through retrofit sensors. All of them appear on one dashboard with one definition of OEE, so they can be compared fairly.
How Does a Machine Monitoring System Work? A 5-Step Process
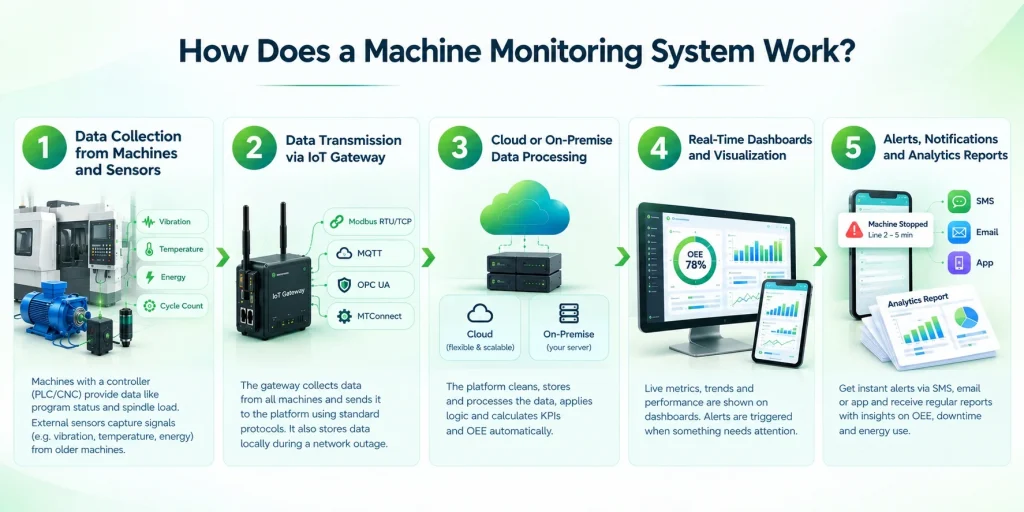
IoT machine monitoring works in five steps: sensors capture machine data, a gateway sends it, a software platform processes it, dashboards display it live, and alerts and reports tell the right people when action is needed.
Step 1: Data Collection from Machines and Sensors
Everything starts at the machine. Machines with a PLC or CNC controller give data directly, such as part count, program status and spindle load, and they connect to the system through standard protocols like OPC UA or MTConnect.
Older machines often have no controller access. On these, external sensors capture machine signals such as on/off status, cycle count, temperature, vibration and energy use. The software then turns these signals into runtime, downtime and utilization. Signals from both types of machine are read fast enough to catch even short stops.
Step 2: Data Transmission via local IoT gateways (Modbus RTU/TCP, MQTT, OPC UA)
An IIoT gateway collects the data from all machines and sends it to the software platform. It speaks the protocols that factory equipment already uses: Modbus RTU/TCP for PLCs, meters and drives, MQTT for lightweight IoT messaging, OPC UA for secure, vendor-neutral communication, and MTConnect or REST API where the machine or system supports them. Machines that use serial communication can be connected through a protocol converter. The gateway turns all these formats into one common structure, so machines of different brands work together, and it stores data locally during a network outage so nothing is lost.
Step 3: Cloud or On-Premise Data Processing
The software platform is the brain of the system. It cleans the raw incoming data, saves it for future use, applies logic parameters (for example, a machine with no cycle for three minutes is marked idle) and calculates OEE and other KPIs automatically.
The platform can run in two ways. In the cloud, the data is stored on internet servers, which is faster to start, easy to scale and viewable from anywhere, so it suits companies with several plants. On-premise means the software runs on servers inside your own factory, which suits companies with strict data policies or weak internet. Either way, encrypted transmission and role-based access keep the data protected.
Step 4: Real-Time Dashboards and Visualization
The processed data appears on dashboards built for different people, and everyone can see live metrics such as OEE (Overall Equipment Effectiveness) as soon as they change. Operators see the target, the running count and a prompt to enter the downtime reason. Supervisors see line-wise status and shift progress. Managers see OEE, utilization and loss trends, and leadership sees a comparison of plants.
The dashboards also act on the data. When a machine stops, slows down or crosses a set limit, the system triggers an alert and automatically sends a notification to the right person, so no one has to keep watching the screen. The dashboards work on shop-floor screens, desktops, tablets and phones, so everyone sees the same numbers. With an AI chatbot, users can also type a question such as “Which machine had the most downtime today?” and get an instant answer.
Step 5: Alerts, Notifications and Analytics Reports
Finally, the system moves from showing data to helping teams take action. It sends an alert by SMS, email or app when a machine stops for too long, cycle time drifts, energy use jumps or a reading crosses its limit. Because the right person hears about a problem in minutes and not hours, response time falls, and that gap is where much of the saving comes from.
The system also turns the same data into analytics reports, which arrive by email for each shift, day or week. Plant leaders use these reports to measure insights such as OEE, downtime causes, utilization and energy use over time. They compare shifts, machines and plants, find the biggest losses, and decide where to act first. In this way, alerts help teams respond to problems as they happen, while reports help leaders find and remove the root causes.
What Can a Machine Monitoring System Track? Key Parameters and KPIs
A machine monitoring system tracks the numbers that show how each machine is performing and where time is lost.
- Machine Status: Shows live whether each machine is running, idle or stopped, so patterns like idle time at shift change become visible.
- OEE (Overall Equipment Effectiveness): The standard measure of productivity: Availability × Performance × Quality. It shows which of the three is causing the most loss.
- Cycle Time and Production Count: Compare actual cycle time with the standard and output with the target, so slow running and shortfalls are caught during the shift.
- Downtime Tracking and Reason Codes: Records every stop with a timestamp and a reason, such as setup, tool change or breakdown, so teams can fix the biggest causes first.
- Machine Utilization: Compares productive time with available time. It reveals hidden capacity that may avoid the need for new machines.
- Energy Consumption per Machine: Links power use to machine activity, so idle-running machines and unusual consumption stand out.
- MTBF and MTTR: MTBF is the average running time between breakdowns (higher is better). MTTR is the average time to repair a machine (lower is better). Together they show reliability and maintenance response.
Difference Between Machine Monitoring System vs. MES vs. SCADA
| Feature | Machine Monitoring System | MES (Manufacturing Execution System) | SCADA |
|---|---|---|---|
| Main purpose | Visibility into machine performance and losses | Managing and controlling production workflow | Supervising and controlling industrial processes |
| Typical users | Plant managers, production and maintenance teams | Production planners, quality and operations teams | Control-room engineers and process operators |
| Key data | Status, OEE, downtime, cycle time, energy | Work orders, traceability, quality, materials | Process values, alarms, set points |
| Control of machines | Usually read-only | Coordinates production, limited machine control | Direct supervisory control |
| Legacy machine support | Yes, through retrofit sensors | Often requires integration effort | Requires PLC or RTU connectivity |
| AI/predictive capability | Common, anomaly detection and failure prediction are now standard | Limited, mostly rules-based workflow logic | Limited, mostly threshold-based alarms |
| Implementation time | Days to weeks | Months | Weeks to months |
| Cost and complexity | Low to moderate | High | Moderate to high |
| What happens if you remove it | You lose visibility into losses, but production doesn’t stop | Production can become disorganized, work orders lose traceability | The process can become unsafe or uncontrolled, the riskiest to remove |
| Typical first ROI signal | Visible within days, usually idle-time or energy waste caught immediately | Takes months, tied to full process redesign | Not really an ROI metric, it’s a safety/control necessity, not a cost-saving tool |
| Best for | AI-driven machine intelligence and automated operations | Full production and quality management | Process control and safety monitoring |
5 Benefits of Machine Monitoring System
A machine monitoring system helps manufacturers lower costs and raise efficiency, because it gives live, accurate data on every machine.
- Decreased Production Cost: Less downtime, less idle running, less scrap and lower energy waste mean the plant spends less to make each part. Machine-wise data shows exactly where money is being lost.
- Reduced Unexpected Repair Cost: Machine history and condition data, such as vibration, temperature and alert alarm trends, help operators plan maintenance before a failure. Costly urgent repairs and the long stoppages that come with them become less frequent.
- Saved Labor Cost: Automatic data capture replaces manual logging, spreadsheets and floor checks. Supervisors and engineers spend less time collecting data and more time on improvement, and operators spend less time on paperwork.
- Increased Efficiency: Live status, OEE and utilization data show where time is lost, so plants recover hidden capacity and get more output from the machines they already own.
- Reduced Unplanned Downtime: Every operation interruption is recorded as it happens, and instant alerts with stop reasons help teams respond faster and stop the same problem from repeating.
Why Do Manufacturers Need Machine Monitoring System?
Problems with Manual Data Collection
Manual records and spreadsheets are slow, inconsistent, and reach managers hours or days late. They also can’t show which machine or shift wasted energy, only the total on the bill. Manual records show what happened; automatic data shows what’s happening now, while there’s still time to act.
The Hidden Cost of Unplanned Downtime
A stoppage means lost production, idle labor, and scrap after restart, plus wasted energy from idle machines still drawing power. Small, unlogged stops often add up to more lost time than one major breakdown. A monitoring system catches all of it automatically, so teams can act the same day instead of finding the loss on next month’s bill.
Lack of Visibility Across Shifts and Lines
Without live data, managers can’t compare how different shifts, operators, or machines are actually performing, they only see totals at the end of the day or week, by which point the cause is hard to trace. A monitoring system puts every line and shift on one dashboard, making gaps in performance visible immediately instead of buried in a weekly summary.
Reduce Manual Work and Labor Cost
A machine monitoring system automates data collection, stoppage recording, alerts and reports, while AI handles routine monitoring and raises maintenance alerts. This reduces manual checks and logging, lowers labor cost, and lets skilled staff focus on repairs and improvement.
Machine Monitoring Use Cases Across Manufacturing Industries
Every industry loses time in different places, so machine monitoring is used differently in each.
- CNC, Metal Fabrication and Industrial Equipment Manufacturing: Shows how long machines actually run versus wait for setup, tools or material. Cycle time and spindle load data expose slow programs and catch tool wear early.
- Automotive Component Manufacturing: Tracks line output against take time, OEE and changeover time, and shows which station is slowing the line. Digital records also support customer audits.
- Food and Beverage Processing: Finds the main causes of line stops and changeovers, compares shifts, and tracks energy use of heating, cooling and refrigeration equipment.
- Pharmaceutical and Chemical Manufacturing: Tracks temperature, pressure and equipment condition, and keeps digital batch records. The team gets an alert and can fix it early and supports compliance and audits.
- Plastics, Textile and Packaging: Tracks cycle time, idling, product changes and scrap, so plants can raise utilization and cut waste.
How to Choose the Right Machine Monitoring Software
Key features to look for
Ideal machine monitoring software gives universal connectivity across both modern PLCs and legacy machines through IIoT sensors, with real-time dashboards, instant downtime alerts, and a simple interface for operators to log downtime reasons while auto-calculating OEE. It should also include condition-based monitoring with AI anomaly detection and built-in energy monitoring, support open APIs for seamless ERP/CMMS integration, work with protocols like Modbus, MQTT, and OPC UA, help calculate ROI, and scale as you grow.
Cloud-based System vs. On-premise System
Cloud-based systems are quick to set up, and if you’re managing multiple sites, scaling becomes easy too, plus they can be accessed remotely. On-premise systems are the opposite, they give you more control over your own data and work better in areas with internet issues, but they’re costlier to maintain.
Questions to ask a vendor
Ask how the system handles machines that have no native connectivity, what happens to your data if the network goes down, how soon you’ll actually see useful insights after installation, which protocols it supports, and whether the quoted price covers hardware, software, and support together or separately.
Common mistakes to avoid
Don’t pick a system that forces you to replace machines or meters you already own. Don’t skip checking how it performs during network downtime, or how well it plugs into your current SCADA, MES, or ERP tools. And don’t choose based on price alone, confirm the AI and alerting features actually hold up for your specific use case before signing off.
Why Choose IOTMATRIX for Machine Monitoring?
IOTMATRIX retrofits onto existing machines with wireless, PLC-based sensors, no rewiring or new equipment needed, so even legacy machines get real-time monitoring within days to weeks. It brings machine status, OEE, downtime, cycle time, and energy data into one dashboard, with built-in AI flagging early signs of wear before they turn into a breakdown. An edge gateway buffers data during network drops, so you never lose visibility, and the system scales from a single machine to an entire facility.
Here are a few clear trends shaping how machine monitoring systems are evolving:
- AI is increasingly used for predictive maintenance, catching early signs of wear like a drift in vibration or current before a machine actually fails.
- Edge computing lets machines process data locally, so insights and instant alerts keep coming even when the network goes down.
- Energy data is merging with performance metrics, giving operators one system that connects downtime and OEE directly to what it’s costing in power, a combination that directly boosts overall efficiency.
- Manufacturers are moving toward a single dashboard across multi plant, comparing performance and energy use across sites instead of monitoring each facility on its own.
How Can Machine Monitoring Help Your Factory Move from Guesswork to Data?
Every issue this guide has covered, late paper logs, unexplained downtime, unclear energy costs, surprise breakdowns, comes down to one thing: data arriving too late to act on. A machine monitoring system fixes this by connecting sensors, legacy machines, and modern PLCs into one live feed, turning scattered signals into real-time OEE, downtime, and energy data the moment it happens.
Early signs of wear get caught before they turn into a breakdown, alerts reach the right person within minutes, and integration with your existing SCADA, ERP, or CMMS systems means the data actually gets used instead of just sitting on a screen. Once a factory can see what’s happening at the machine level in real time, “we think” stops being the answer, the only real question left is where to start.
Transform machine downtime into predictive action before production stops.
Yes. It connects to a plant’s existing machines, network, and software, so nothing needs to be replaced. Machines with controllers connect through standard protocols, older machines connect through external sensors, and machine data can pass to the current ERP or MES through REST API.
Machine status (running, idle, stopped), OEE, cycle time, production count, downtime with reasons, utilization, energy use per machine, and reliability measures such as MTBF and MTTR.
Yes. External sensors such as current sensors, proximity sensors, and stack-light readers capture signals without changing the machine’s wiring. Machines with Modbus or serial communication can connect through a protocol converter.
Yes. An IIoT gateway that supports Modbus, MQTT, OPC UA, MTConnect, and REST API can bring machines of different brands and ages onto one dashboard, with one OEE definition so they can be compared fairly.
Yes. Through open interfaces such as REST API, the platform can pass production counts, downtime, and machine status to existing systems, so they keep working with live shop-floor data.
The AI chatbot lets users type a question such as “Which machine had the most downtime today?” and get an answer within seconds, with no report or filter needed. Neither the chatbot nor the system replaces operators, they reduce manual logging and checking so people can focus on repairs and improvement.
MTBF is operating time divided by the number of failures, and MTTR is total repair time divided by the number of repairs. A falling MTBF points to a reliability problem, and a high MTTR points to slow repairs. Monitoring supplies this history, and predictive maintenance uses it, often with AI, to warn of a failure before it happens.
Most deployments take days to a few weeks, not months. Since it works with your existing machines and network, there’s no major infrastructure rebuild, sensors and gateways are installed, connected to the platform, and the dashboard starts showing live data shortly after.