Book Demo

Industry IoT Solutions For

Automotive Manufacturing Plants Monitoring

AI-powered monitoring of machines, energy, and production, with one dashboard and one assistant that answers questions about your whole plant. Works with the PLCs, CNC machines, and meters you already have.

Monitors:
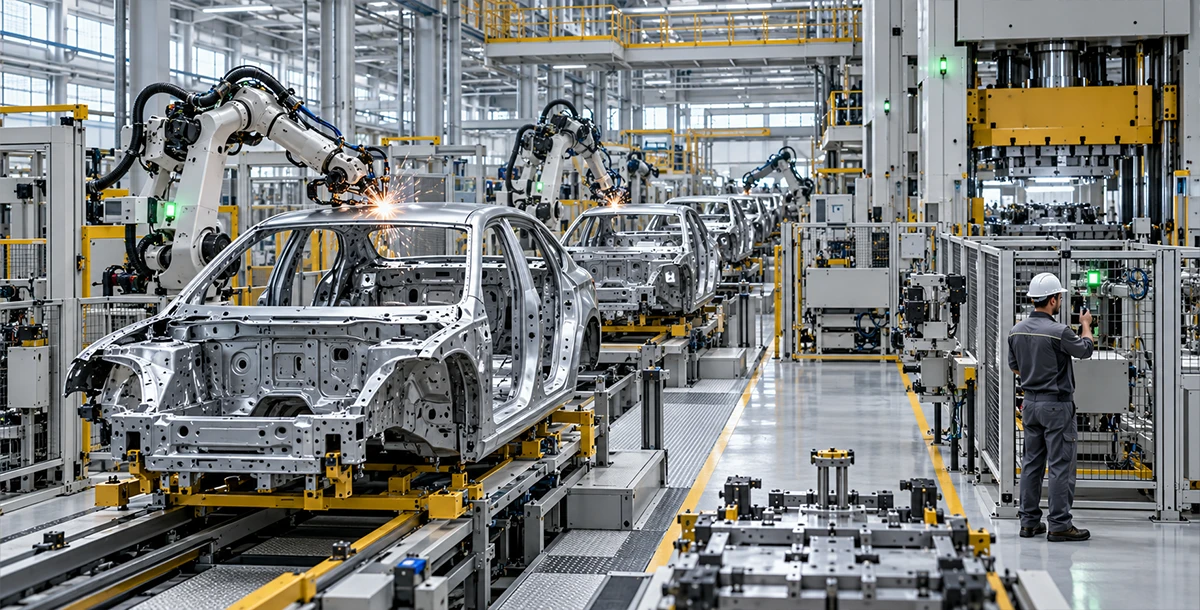
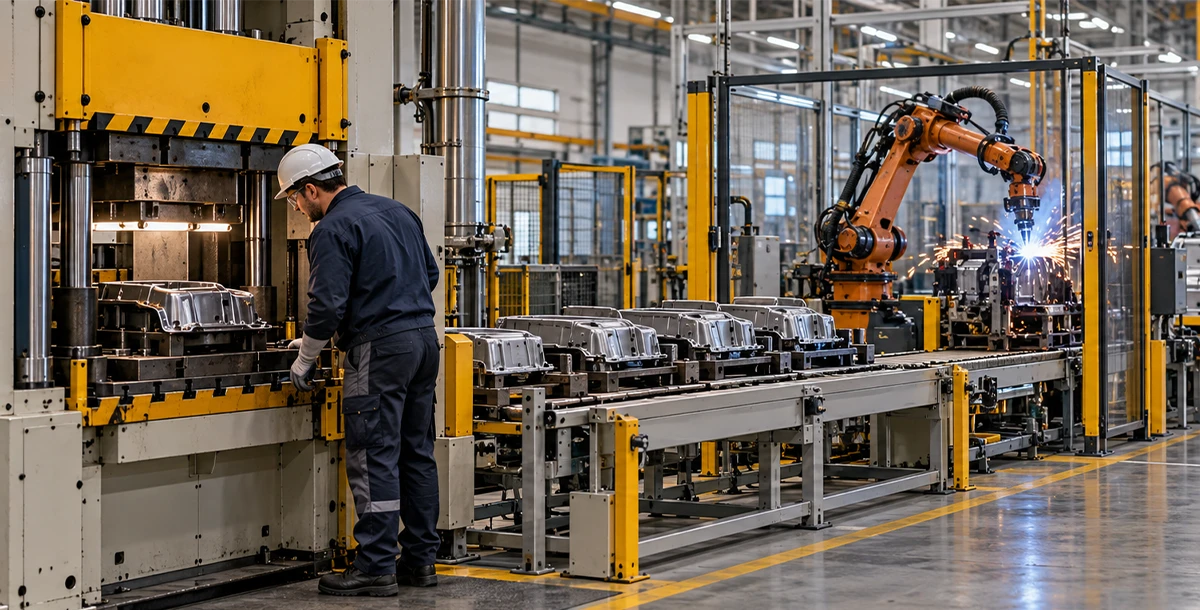
Press & Welding Lines
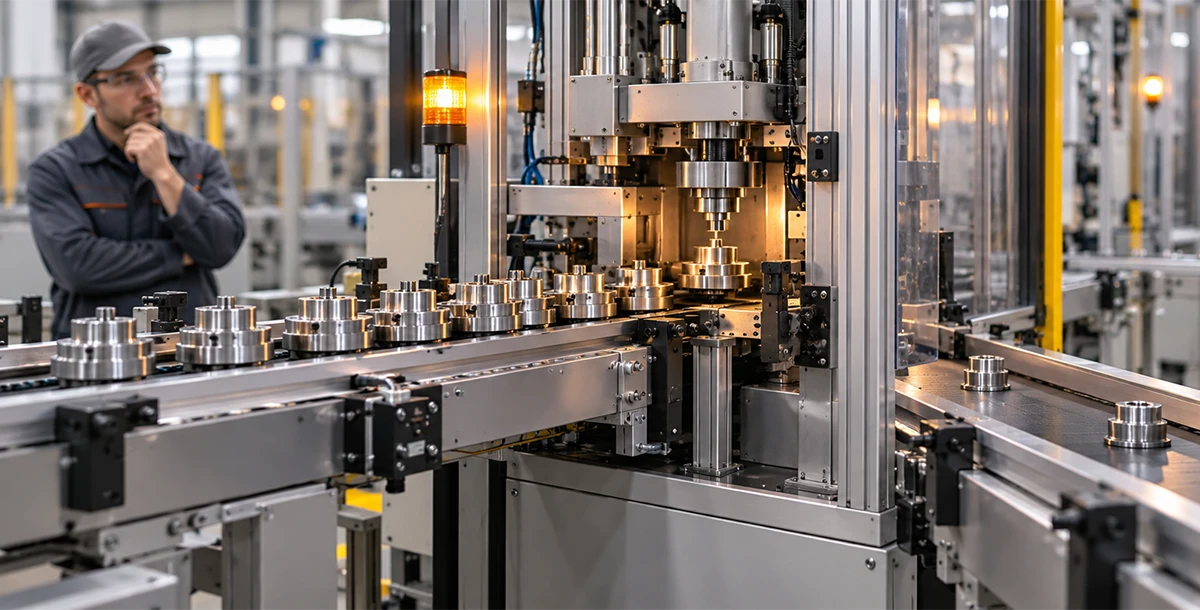
CNC & Machining
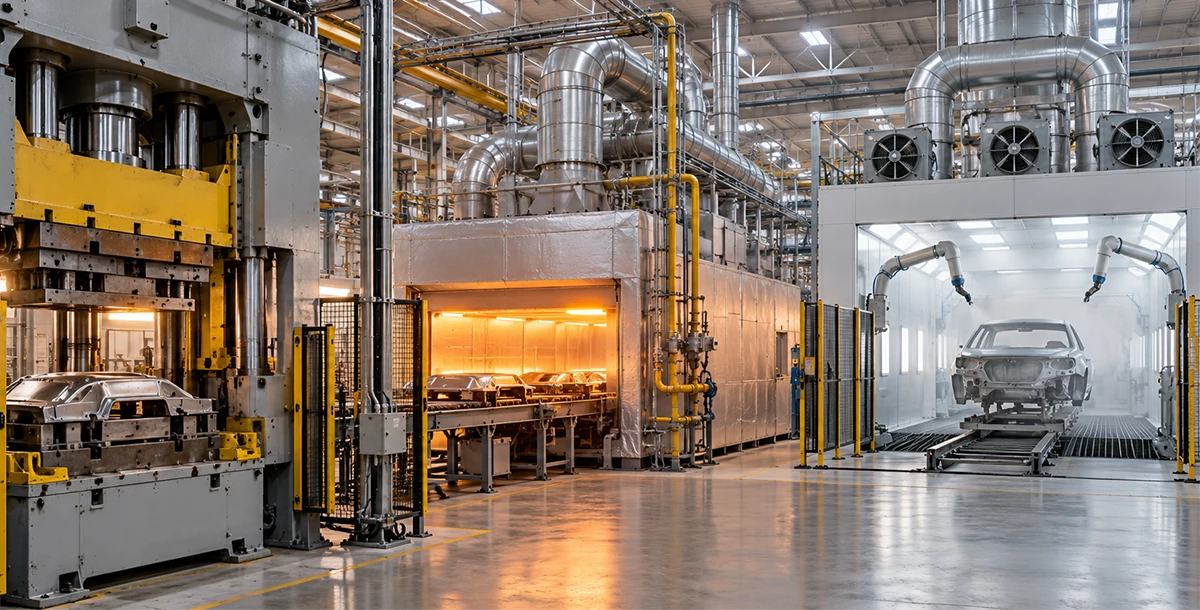
Paint Shop & Ovens
Assembly & Conveyors
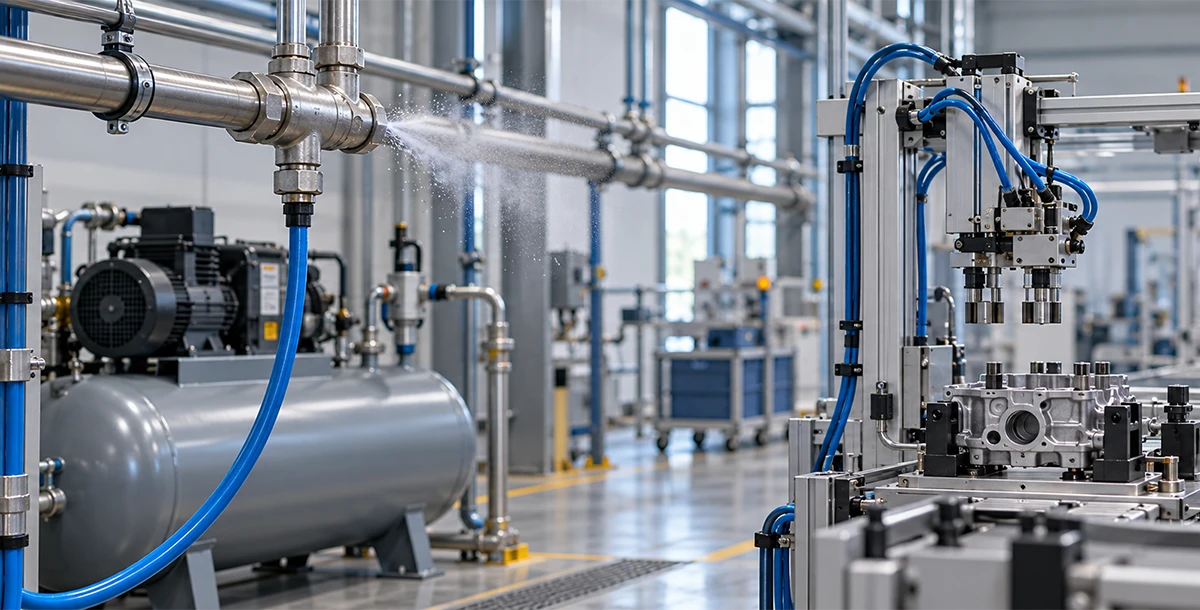
Compressed Air
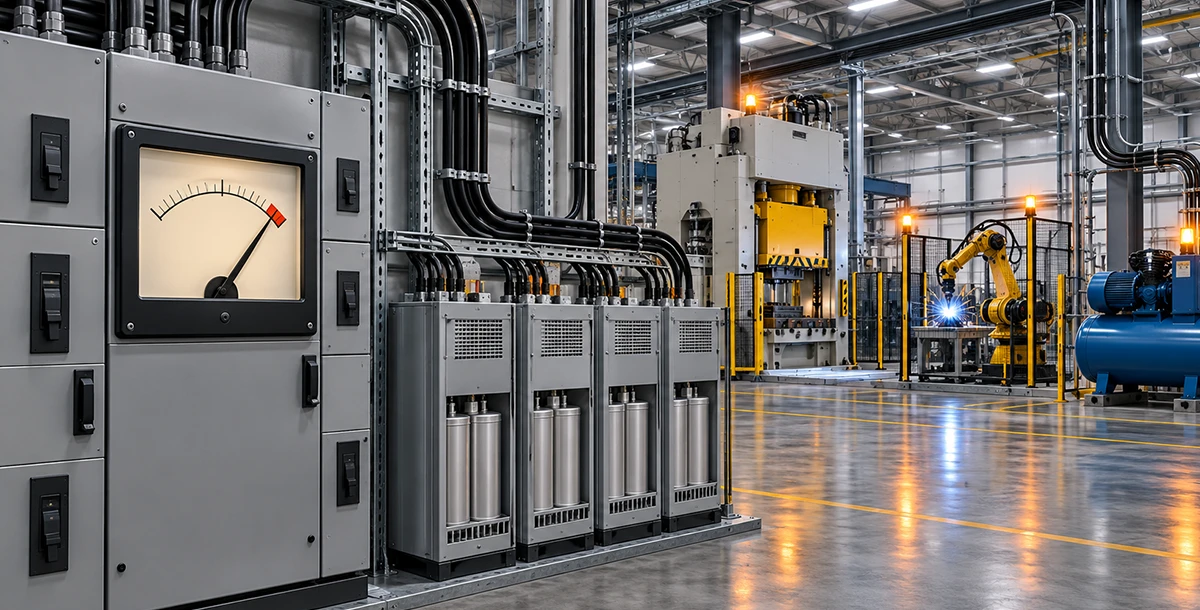
Power Quality & DG

Smart AI-Powered Automotive Manufacturing Plant Monitoring System

IOTMATRIX’s IoT-based, AI-powered monitoring system for automotive manufacturing plants uses sensors, a live dashboard, and AI monitoring system system track machines, energy, and production anomalies in real-time and  one place. It shows your team which press, welding, and assembly lines are losing time or energy, alerts you to problems early, and calculates costs and ROI, using the PLCs, CNC machines, and meters already installed in your plant.

Instead of waiting for shift or month-end reports, your team can ask the AI chatbot a question about any line, machine, or utility and get a clear answer from live plant data.

The Real Cost of Downtime, Idle Energy, and Slow Cycles in Automotive Plants

A stopped line, a slow machine, or an idle compressor may look small in a single shift. Across a month, these hidden downtime, energy, and production losses can cost an automotive plant lakhs of rupees. Because most of them go unrecorded, teams only find out after the output is already lost.

01

Unplanned Stoppages on Press, Welding, and Assembly Lines

When one machine stops, the lines around it wait. Without live status, teams learn about the problem late and spend time finding out which machine caused it.

02

Slow Running and Short Stops That Never Get Logged

Machines that run below their rated speed, or stop for a minute at a time, rarely appear in handwritten logs. Together they can cost more output than one long breakdown.

03

High Energy Use in Presses, Ovens, and Paint Shops

Presses, curing ovens, paint booths, and heat treatment use large amounts of electricity and gas. Without machine-wise data, nobody knows which equipment is using more than it should.

04

Compressed Air Leaks and Idle Running

Compressed air feeds tools and automation across the plant, and leaks are common. They waste power around the clock and rarely show up as a separate cost.

05

Maximum Demand Spikes from Simultaneous Start-Ups

When presses, welding machines, and compressors start together, maximum demand jumps. Low power factor adds a charge on top.

06

A Mix of Old and New Machines on the Same Line

Most plants run machines from different brands and different decades. Getting all of them into one view is hard without replacing equipment.

07

Manual Shift Reports and Delayed Data

Handwritten logs and end-of-month reports mean problems are found after the loss has happened, and nobody can tie energy or downtime to a specific line, shift, or part.
Unplanned stoppages on press, welding, and assembly lines Slow running and short stops that never get logged High energy use in presses, ovens, and paint shops Compressed air leaks and idle running in automotive plant Maximum demand spikes from simultaneous start-ups Mix of old and new machines on the same production line Manual shift reports and delayed data

Unplanned Stoppages

Identify line stoppage roots in real time before surrounding assembly stops.

Slow Cycles & Micro-Stops

Capture unlogged sub-minute drops and machine throttling automatically.

Intensive Process Utilities

Track discrete kilowatt and gas draw across curing booths, ovens, and presses.

Pneumatic & Air Waste

Detect continuous line leaks and non-productive compressor idling 24/7.

Peak Demand Penalties

Stagger high-load startups to avoid grid penalties and low power factor charges.

Heterogeneous Fleet Visibility

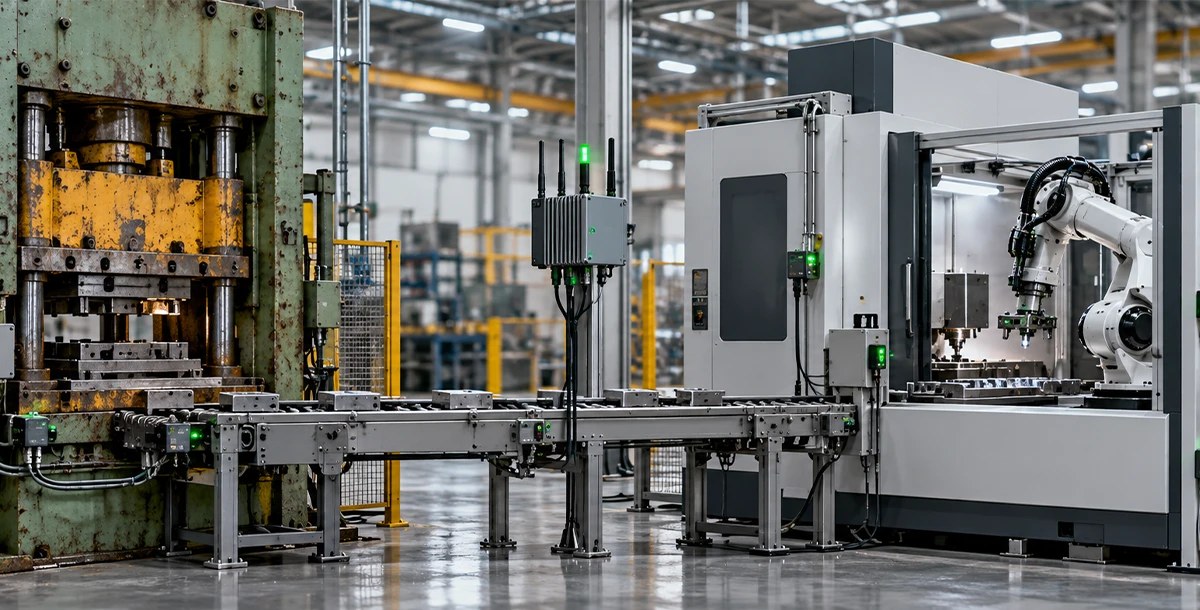
Bridge vintage machines with modern PLCs into a unified telemetry plane.

Real-Time Shift Attribution

Eliminate manual paper logs with automated energy and downtime correlation.

Unplanned stoppages on press, welding, and assembly lines
01

Unplanned Stoppages on Press, Welding, and Assembly Lines

When one machine stops, the lines around it wait. Without live status, teams learn about the problem late and spend time finding out which machine caused it.

Slow running and short stops that never get logged
02

Slow Running and Short Stops That Never Get Logged

Machines that run below their rated speed, or stop for a minute at a time, rarely appear in handwritten logs. Together they can cost more output than one long breakdown.

High energy use in presses, ovens, and paint shops
03

High Energy Use in Presses, Ovens, and Paint Shops

Presses, curing ovens, paint booths, and heat treatment use large amounts of electricity and gas. Without machine-wise data, nobody knows which equipment is using more than it should.

Compressed air leaks and idle running
04

Compressed Air Leaks and Idle Running

Compressed air feeds tools and automation across the plant, and leaks are common. They waste power around the clock and rarely show up as a separate cost.

Maximum demand spikes from simultaneous start-ups
05

Maximum Demand Spikes from Simultaneous Start-Ups

When presses, welding machines, and compressors start together, maximum demand jumps. Low power factor adds a charge on top.

Mix of old and new machines on the same line
06

A Mix of Old and New Machines on the Same Line

Most plants run machines from different brands and different decades. Getting all of them into one view is hard without replacing equipment.

Manual shift reports and delayed data
07

Manual Shift Reports and Delayed Data

Handwritten logs and end-of-month reports mean problems are found after the loss has happened, and nobody can tie energy or downtime to a specific line, shift, or part.
Plant-Wide Operations, Machine and Energy Monitoring Coverage

Press Shop & Stamping

Machine status, running hours, downtime logging, and energy measured per press stroke.

Welding & Robotics

Real-time machine status and electrical power draw for weld cells and robotic arms.

CNC & Machining

Spindle load and cycle status delivered via direct PLC and native CNC control integration.

Paint Shop & Curing Ovens

Electricity and fuel gas consumption tracking via pulse and analog meter integrations.

Assembly & Conveyors

Live running, idle, and stopped status tracking across each line section and sub-cell.

Compressed Air

Compressor power draw and volumetric air flow telemetry to identify leaks and idle run.

Power Quality & DG Backup

Voltage, current, power factor, peak demand spikes, and fuel-to-kWh diesel generator usage.

Captive Rooftop Solar

Generation tracking balanced directly against utility grid draw and DG set consumption.

Machine monitoring dashboard for automotive manufacturing plant

Machine & Assembly Line Monitoring for Automotive Manufacturing Plants

See which presses, CNC machines, weld cells, and assembly lines are running, idle, or stopped, and why. PLC-based and older machines connect to one live dashboard, so your team no longer depends on handwritten logs.

  • Live Running, Idle & Stopped Status
  • Downtime Tracking with Reasons
  • Multi-Brand PLC & Legacy Machine Connectivity
  • Real-Time OEE & Line Performance Analytics
  • AI Tracking & Instant SMS and WhatsApp Alerts
Explore Machine Monitoring
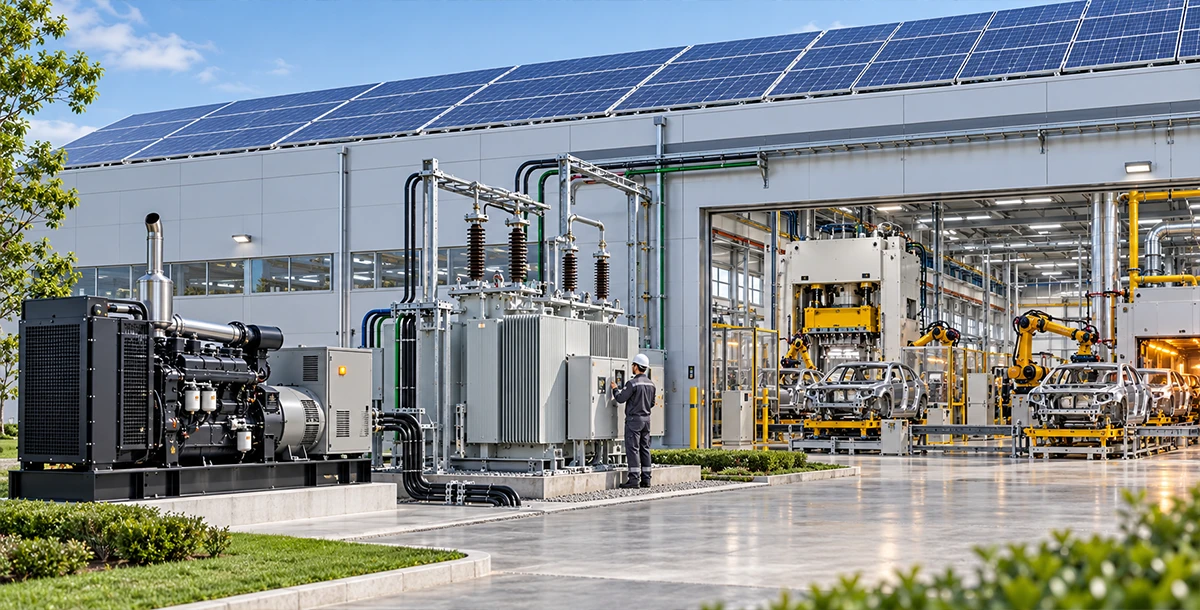
Energy and gas monitoring system for automotive manufacturing plant

Energy & Gas Monitoring for Automotive Manufacturing Plants

Clamp-on sensors show energy and gas use by press, weld cell, paint line, and curing oven, using your existing panels and meters. Find idle load and peak demand spikes early, before they show up on the monthly bill.

  • Press, Weld & Paint Shop Energy Breakdown
  • Energy per Vehicle, Part, or Batch
  • Gas Tracking on Curing Ovens & Heat Treatment
  • Peak Demand & Power Factor Control
  • Utility Bill & ROI Calculated from Real Data
Explore Energy Monitoring
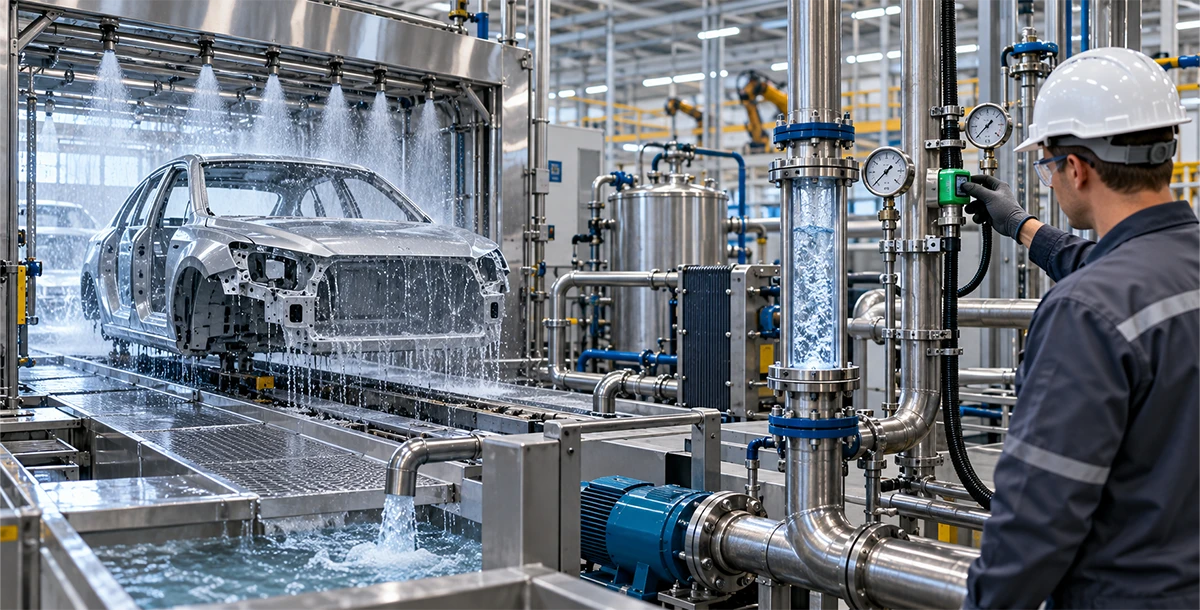
Water and coolant monitoring system for automotive manufacturing plant

Water & Coolant Monitoring for Automotive Manufacturing Plants

Track flow, pressure, and leaks across pre-treatment, rinse, coolant, and effluent lines. See how much water each vehicle or part uses, and catch leaks the same day instead of weeks later.

  • Flow Tracking at Pre-Treatment, CED & Rinse Lines
  • Coolant Loop Flow, Pressure & Leak Alerts
  • Water per Vehicle or Part for ESG Reporting
  • ETP and Treatment Plant Flow Tracking
  • Ask the AI Chatbot About Any Utility
Explore Water Monitoring

AI-Powered Production and Energy Intelligence for Automotive Plants

Monitoring shows what happened. IOTMATRIX's AI layer works on that data to explain why, flag problems early, and answer your team's questions without anyone building a report.

01 // Machine & Energy Tracking

AI Self-Monitoring and Tracking of Machines, Energy, and Production

The system learns what normal looks like for each press, weld cell, CNC machine, and line, and keeps watching it. If power draw, speed, or output drifts from that baseline, you know within moments, not at the end of the shift.

  • Learns normal behavior automatically, with alert limits you can adjust
  • Flags abnormal energy, output, or downtime patterns instantly
  • Alerts by SMS, email, and WhatsApp
02 // Predictive Maintenance

Predictive Alerts That Catch Faults Before a Line Stops

Instead of reacting to a breakdown, your maintenance team gets an early warning when a machine starts behaving differently. That turns an emergency stop into a planned fix.

  • Early warning on abnormal power draw and developing machine faults
  • Fewer sudden breakdowns and unplanned stops
  • Maintenance planned around production, not around failures
03 // Load Management

Automated Peak Demand and Load Management

Presses, compressors, and ovens starting together can push maximum demand up and trigger a penalty. The AI predicts demand spikes and alerts you in time to spread the load.

  • Predicts peak demand before it happens
  • Auto-alerts to stagger heavy loads
  • Helps avoid maximum demand penalties
04 // Shift & Line Analytics

AI Performance Analytics Across Lines, Shifts, and Machines

Compare every line, shift, and machine on availability, output, downtime, and energy in one view. See which line is least efficient and which shift loses the most time, without building a report.

  • Line-wise, shift-wise, and machine-wise comparison
  • Real-time OEE visibility
  • Historical trends for planning and review
05 // Plant Operations Assistant

AI Chatbot for Plant Operations and Utility Consumption

Ask a question in plain language and get one clear answer from your plant’s own data. Plant heads, maintenance teams, and finance can all get answers without waiting for anyone to pull a report. Examples: “Which line had the most downtime this week?” “Which machine used the most energy last month?” “Why did the weld line stop yesterday?”

  • One prompt for the whole plant: machines, energy, production
  • Answers based on your live and historical plant data
  • Answers in seconds, with no analyst needed
06 // ROI & Billing

Automated ROI and Utility Bill Calculation

The system calculates your utility bill from actual consumption and tracks the savings from every improvement against your baseline. The return on monitoring is a number you can show your management, not an estimate.

  • Utility bill calculated from real consumption data
  • Savings and payback tracked automatically
  • Clear figures for management and audit discussions
07 // Remote Control

Remote Control of Connected Equipment

Switch connected equipment on or off from a mobile or desktop, and set your own alert limits, without a trip to the shop floor.

  • Control connected relays from mobile or desktop
  • Adjustable alert thresholds
  • Manage the plant from anywhere
Machine & Energy Tracking Predictive Alerts Peak Demand Management Performance Analytics Plant Operations Assistant Automated ROI Remote Control Equipment
Machine Tracking
01 // Machine & Energy Tracking

AI Self-Monitoring and Tracking of Machines, Energy, and Production

The system learns what normal looks like for each press, weld cell, CNC machine, and line, and keeps watching it.

Predictive Alerts
02 // Predictive Maintenance

Predictive Alerts That Catch Faults Before a Line Stops

Instead of reacting to a breakdown, your maintenance team gets an early warning when a machine starts behaving differently.

Peak Demand Management
03 // Load Management

Automated Peak Demand and Load Management

Presses, compressors, and ovens starting together can push maximum demand up and trigger a penalty.

Performance Analytics
04 // Shift & Line Analytics

AI Performance Analytics Across Lines, Shifts, and Machines

Compare every line, shift, and machine on availability, output, downtime, and energy in one view.

Plant Operations Assistant
05 // Plant Assistant

AI Chatbot for Plant Operations and Utility Consumption

Ask a question in plain language and get one clear answer from your plant’s own data.

Automated ROI
06 // ROI & Billing

Automated ROI and Utility Bill Calculation

The system calculates your utility bill from actual consumption and tracks the savings from every improvement against your baseline.

Remote Control Equipment
07 // Remote Control

Remote Control of Connected Equipment

Switch connected equipment on or off from a mobile or desktop, and set your own alert limits, without a trip to the shop floor.

Ready to Optimize Your Plant's Performance?

Transform your industrial data into decisive action. Connect your machines, monitor utilities in real-time, and cut operational costs with MatrixIQ's industrial IoT platform.

STN 01 : STAMP STN 02 : POWERTRAIN STN 03 : COAT & FINISH FINAL RUN >>
Scroll to top
Call Now Button